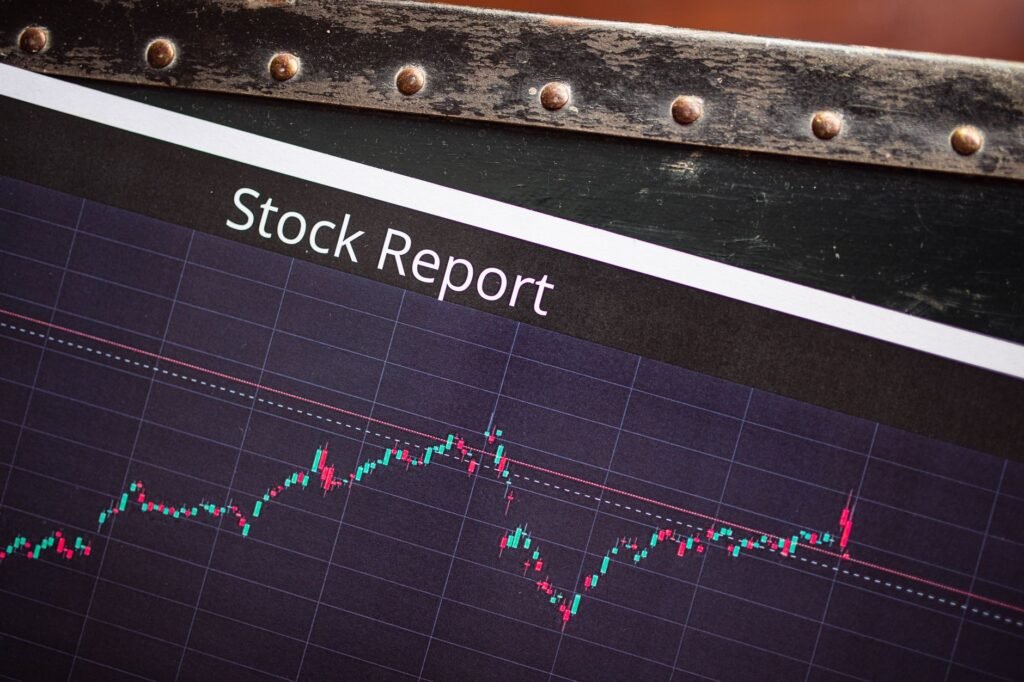

In the dynamic world of financial markets, understanding price action is paramount for traders seeking to identify potential entry and exit points. Two fundamental pillars of technical analysis, support and resistance levels and trendlines, serve distinct yet complementary roles in this endeavor. This article will compare and contrast these essential technical analysis tools, shedding light on their individual mechanisms and how traders often utilize them to gain insights into market sentiment and future price movements.
Understanding Support and Resistance Levels
Support and resistance levels are specific price zones where buying or selling pressure is expected to be strong enough to temporarily halt or reverse the direction of price. These levels are often described as invisible barriers on a price chart.
What Defines Support and Resistance?
- Support: A price level where demand is strong enough to prevent the price from falling further. When a price approaches a support level, buying interest tends to increase, potentially leading to a bounce or a consolidation.
- Resistance: A price level where supply is strong enough to prevent the price from rising further. As a price nears a resistance level, selling interest tends to increase, potentially leading to a pullback or a reversal.
These levels are typically formed by previous peaks and troughs, which traders often view as historical points of market memory. The more frequently a price reacts to a certain level, the stronger that support or resistance is generally considered to be. Furthermore, a broken support level can become a new resistance level, and vice-versa, a concept known as polarity change.
How Traders Use Support and Resistance
Traders employ support and resistance to:
- Identify potential reversals: Prices often reverse direction upon hitting strong support or resistance.
- Determine entry and exit points: Buying near support and selling near resistance are common strategies.
- Place stop-loss orders: A stop-loss order might be placed just below a support level or just above a resistance level to manage risk.
- Gauge market sentiment: The reaction of price to these levels can indicate the strength of buyers or sellers.
In 2026, with the increased prevalence of algorithmic trading and high-frequency trading firms, the integrity of well-established support and resistance zones remains relevant, as human psychology still plays a role in market structure, even if automated systems now execute a vast majority of trades based on similar principles.
Decoding Trendlines
While support and resistance focus on horizontal or dynamic price barriers, trendlines are diagonal lines drawn directly on a price chart to connect a series of highs or lows, indicating the prevailing direction and momentum of a market.
What Defines a Trendline?
- Uptrend Line: Drawn by connecting at least two consecutive rising low points. It acts as a dynamic support, indicating that buyers are stepping in at progressively higher prices.
- Downtrend Line: Drawn by connecting at least two consecutive falling high points. It acts as a dynamic resistance, indicating that sellers are pushing prices down at progressively lower levels.
A valid trendline typically requires at least two points for drawing, but three or more points touching the line generally confirm its strength and significance. Trendlines can also form channels when parallel lines are drawn to encompass price action within a defined range.
How Traders Use Trendlines
Trendlines are vital for:
- Identifying the trend direction: Clearly showing whether the market is in an uptrend, downtrend, or sideways movement.
- Spotting potential reversals or accelerations: A break below an uptrend line or above a downtrend line can signal a potential trend reversal or a significant shift in momentum.
- Establishing dynamic support or resistance: Prices often bounce off a valid trendline, treating it as a dynamic area of interest.
- Anticipating entry and exit points: Similar to S&R, traders might look to buy on bounces off an uptrend line or sell on rejections from a downtrend line.
Given the persistent discussion around market efficiency and the impact of global macroeconomic shifts in 2026, understanding trends, as identified by trendlines, helps market participants frame their longer-term perspectives and short-term tactical decisions amidst fluctuating economic indicators and sector-specific narratives.
Key Similarities and Differences
While both support/resistance and trendlines are cornerstone tools in technical analysis for identifying potential price turning points, their fundamental nature differs.
Similarities:
- Predictive Potential: Both tools aim to forecast where price might react in the future based on historical behavior.
- Market Psychology: They reflect collective market psychology, showing where significant buying or selling pressure emerged in the past.
- Entry/Exit Signals: Both are used to identify potential areas for entering or exiting trades, as well as placing stop-loss orders.
- Dynamic Nature: While often depicted as fixed, their significance can change; for instance, a strong support can become resistance once broken.
Differences:
- Orientation: Support and resistance are typically horizontal or dynamic price levels (e.g., from moving averages), representing specific price points. Trendlines are diagonal, representing the angle and momentum of price movement.
- What They Track: Support/resistance track price zones where supply/demand imbalances occurred. Trendlines track the directional path of price, showing the progression of higher lows in an uptrend or lower highs in a downtrend.
- Implied Action: Support/resistance often imply potential reversals or consolidation. Trendlines often imply continuation of the existing trend, with a break signaling a potential reversal.
Combining Support & Resistance with Trendlines
Many experienced traders do not rely on just one tool but rather seek confluence, where multiple indicators or patterns align to provide stronger signals. Combining support and resistance with trendlines can significantly enhance the reliability of trading signals.
For example, if an asset’s price is in an uptrend, and it approaches a horizontal support level that also coincides with a rising uptrend line, this area presents a potent confluence zone. The double layer of support (horizontal and diagonal) suggests a higher probability of a price bounce. Conversely, if an asset breaks below an uptrend line and also falls below a significant horizontal support level, it could signal a more robust bearish reversal than either signal alone.
Traders might also look for scenarios where a breakout above a downtrend line encounters immediate resistance from a historical horizontal resistance level, indicating a potential struggle for buyers to sustain upward momentum.
Market Context and Application in 2026
In 2026, financial markets continue to evolve with advancements in data analytics and artificial intelligence, yet the foundational principles of supply and demand, reflected through technical analysis, remain constant. While market volatility might be influenced by factors like evolving monetary policies, geopolitical events, and technological disruptions, the ability to identify key price levels and trends is crucial.
These tools are not infallible predictors but rather frameworks for understanding market structure and probabilities. The effectiveness of support and resistance and trendlines lies in their widespread adoption, creating a self-fulfilling prophecy to some extent, as many market participants are looking at the same information. Regardless of the sophisticated tools available today, the core visual insights provided by these classical technical analysis components help frame trading decisions.
Conclusion
Support and resistance levels and trendlines are indispensable tools for technical traders, each offering a unique perspective on price action. Support and resistance define critical price zones of supply and demand, while trendlines illustrate the directional momentum of the market. While distinct, their power is often amplified when used in conjunction, providing traders with a more comprehensive view of potential market turns and continuations. Integrating these tools into a broader trading strategy can offer valuable insights, helping traders navigate the complexities of financial markets with greater clarity.
Disclaimer: This article is provided for general informational and educational purposes only and does not constitute financial, investment, trading, or legal advice. Gainsium is not a registered investment advisor. Markets are volatile and past performance does not guarantee future results. Readers should conduct their own research and consult a licensed financial advisor before making any investment decisions.