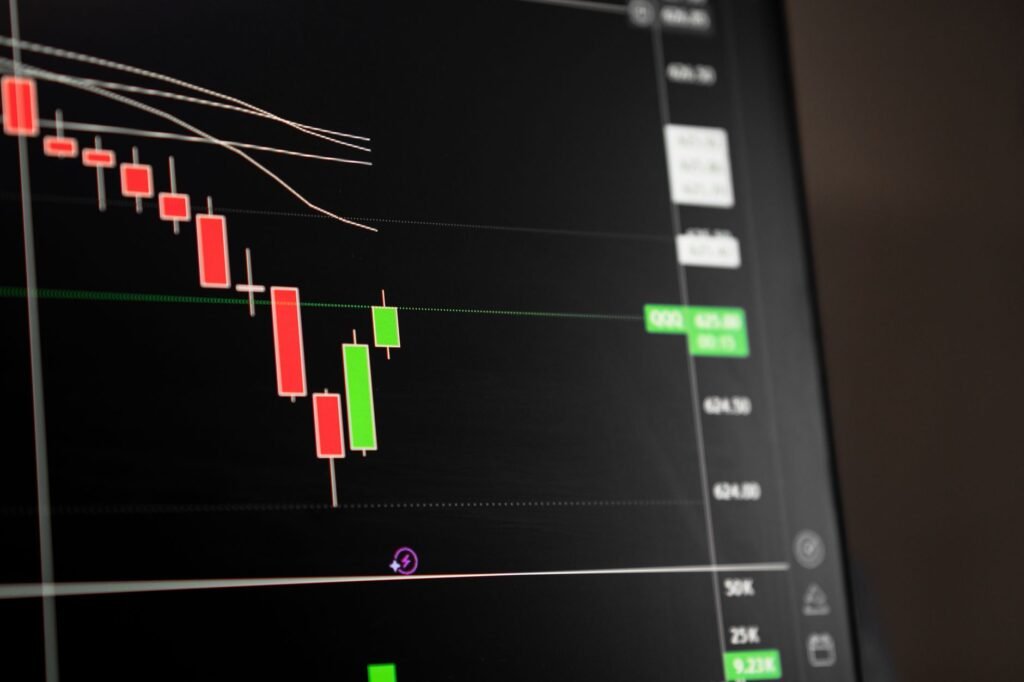

Market order flow refers to the real-time stream of buy and sell orders that actively drive price movements in financial markets. Understanding this fundamental process is crucial for gaining insights into the current supply and demand dynamics of an asset, which can potentially reveal market sentiment and inform trading decisions. This 2026 guide explores how to interpret order flow effectively to identify potential trading opportunities and gain a deeper understanding of overall market behavior.
What is Market Order Flow?
At its core, market order flow is the observable sequence of transactions occurring at various price levels. Every price movement, whether up, down, or sideways, is a direct result of buying and selling activity. Traders typically encounter two main types of orders: limit orders and market orders. Limit orders are passive, resting on the order book (also known as the Depth of Market or DOM) at a specific price, waiting to be filled. Market orders are aggressive; they execute immediately against the best available limit orders on the opposite side of the book, thus consuming liquidity and driving price.
The collective actions of these orders paint a picture of who is more aggressive at any given moment—buyers pushing prices higher by hitting asks, or sellers driving prices lower by hitting bids. Analyzing this interaction allows market participants to gauge the immediate strength of supply and demand, offering a more granular view than traditional chart patterns or indicators alone.
Key Components of Order Flow Analysis
Several tools and concepts are essential for dissecting market order flow:
The Order Book (Depth of Market – DOM)
The order book displays the quantity of buy limit orders (bids) and sell limit orders (offers/asks) at different price levels around the current market price. It represents potential future supply and demand. Traders often look for large clusters of bids or offers, which can indicate areas of potential support or resistance. However, it’s important to recognize that the order book shows intentions, not executed trades, and can be influenced by techniques like ‘spoofing’ (placing large orders with no intention of filling them to mislead other participants).
Time and Sales (The Tape)
Also known as the ‘tape,’ the time and sales window shows every executed trade in real time. It records the price, size, and timestamp of each transaction. Crucially, it identifies whether a trade was initiated by an aggressor buying at the ask or selling at the bid. This helps traders discern who is actively pushing prices and at what volume. For example, a rapid succession of large trades occurring at the ask price suggests strong aggressive buying pressure.
Volume Profile and Market Profile
These analytical tools display the total volume traded at each price level over a specified period. A Volume Profile typically creates a histogram on the side of a chart, highlighting areas where most trading activity has occurred (high volume nodes) and areas of low activity (low volume nodes). A Market Profile organizes price and volume data into a bell-curve shape, identifying the value area (where the majority of trading occurred) and the point of control (the price level with the highest volume). These profiles help identify significant price areas that attract or repel trading interest, which can act as future support or resistance.
Order Flow Imbalance and Cumulative Delta
Order flow imbalance refers to the disparity between aggressive buying and aggressive selling pressure within a specific timeframe or at particular price levels. Tools like Cumulative Delta track the running total of aggressive buys minus aggressive sells over a period. A rising cumulative delta indicates more aggressive buying, while a falling delta suggests stronger aggressive selling. This can provide a clearer picture of who is currently in control of price action and whether that control is strengthening or weakening.
Interpreting Order Flow for Trading Opportunities
Analyzing order flow can assist traders in several ways:
Identifying Supply and Demand Zones
Concentrations of large limit orders on the DOM can highlight potential areas where institutional interest lies, signaling strong supply or demand. Similarly, areas on the Volume Profile with significant traded volume indicate prices where substantial price discovery and agreement occurred, often acting as pivot points in future price action.
Detecting Market Reversals and Continuations
Order flow can provide early clues about potential reversals. For instance, if prices are rising but aggressive buying volume begins to diminish while large sell limit orders appear and absorb the buying pressure, it could signal buying exhaustion. Conversely, sustained aggressive buying or selling volume breaking through key price levels can confirm a trend’s continuation.
Confirmation of Breakouts
When a price attempts to break out of a consolidation range or through a significant resistance/support level, observing a surge in aggressive volume on the side of the breakout can confirm its validity. A breakout accompanied by little aggressive volume might indicate a ‘fake out’ or a lack of conviction from market participants.
Understanding Institutional Activity
While large institutional orders are often fragmented or hidden across various venues (e.g., dark pools) to minimize market impact, significant block trades appearing on the tape, or consistent absorption of orders at critical levels, can sometimes hint at institutional accumulation or distribution. Order flow provides a way to ‘read between the lines’ of price action for these larger footprints.
Historical Context and the 2026 Market Landscape
The ability to analyze market order flow has evolved significantly. Historically, order flow was primarily observed on trading floors. The advent of electronic trading transformed access, democratizing data, though sophisticated analysis tools often require professional subscriptions.
Dominance of Algorithmic and High-Frequency Trading (HFT)
In 2026, algorithmic and high-frequency trading (HFT) strategies continue to dominate a substantial portion of market liquidity and execution. This means that order books can be highly dynamic, with bids and offers appearing and disappearing in milliseconds. HFT can create ‘noise’ that makes identifying genuine directional interest challenging, as algorithms often probe for liquidity or employ complex order routing strategies. Understanding these automated behaviors is increasingly vital for order flow analysts.
Fragmented Market Structure
Modern markets in 2026 are highly fragmented, with trades occurring across multiple exchanges, alternative trading systems (ATS), and dark pools. This fragmentation means no single order book provides a complete picture of liquidity. While consolidated tape feeds exist for professional users to aggregate data, retail traders often face limitations in seeing the full depth of the market across all venues. Specialized data feeds and platforms are often necessary to gain a comprehensive view of global order flow.
Increased Retail Participation and Advanced Tools
Retail traders in 2026 have access to more sophisticated order flow tools than ever before, often integrated into advanced trading platforms. Furthermore, the application of artificial intelligence (AI) and machine learning (ML) in market analytics is becoming more prevalent, assisting traders in identifying complex patterns and anomalies in vast streams of order data. This technological advancement allows for more nuanced interpretations but also demands a deeper understanding of the underlying market mechanics.
Global macroeconomic factors, such as sustained inflationary pressures in some economies or shifts in central bank monetary policies, continue to influence overall market liquidity and volatility. These factors directly impact how order flow manifests, often leading to sudden surges or withdrawals of liquidity. Geopolitical developments also play a crucial role, frequently causing abrupt shifts in market dynamics that make real-time order flow analysis a critical component for timely reactions.
Challenges and Considerations
While powerful, order flow analysis comes with its own set of challenges:
Data Overload and Latency
The sheer volume of real-time market data can be overwhelming, requiring robust software and significant processing power. Speed of execution is also critical, and retail traders may face inherent latency disadvantages compared to institutional and HFT firms.
Spoofing and Manipulation
Despite regulatory efforts, practices like ‘spoofing’ (placing large, non-bonafide orders to create false impressions of supply or demand) can still occur. Traders must be aware that the order book can sometimes present a misleading picture of true intentions.
Context is King
Order flow analysis should never be used in isolation. It provides micro-level insights that are most effective when combined with other forms of analysis, such as technical analysis (chart patterns, price action), fundamental analysis, and a broad understanding of macroeconomic trends and news events.
No Crystal Ball
Order flow provides probabilities and potential insights, not certainties. Market conditions can change rapidly, and even the clearest order flow signals can fail. Therefore, robust risk management strategies are paramount when incorporating order flow into any trading approach.
Disclaimer: This article is provided for general informational and educational purposes only and does not constitute financial, investment, trading, or legal advice. Gainsium is not a registered investment advisor. Markets are volatile and past performance does not guarantee future results. Readers should conduct their own research and consult a licensed financial advisor before making any investment decisions.