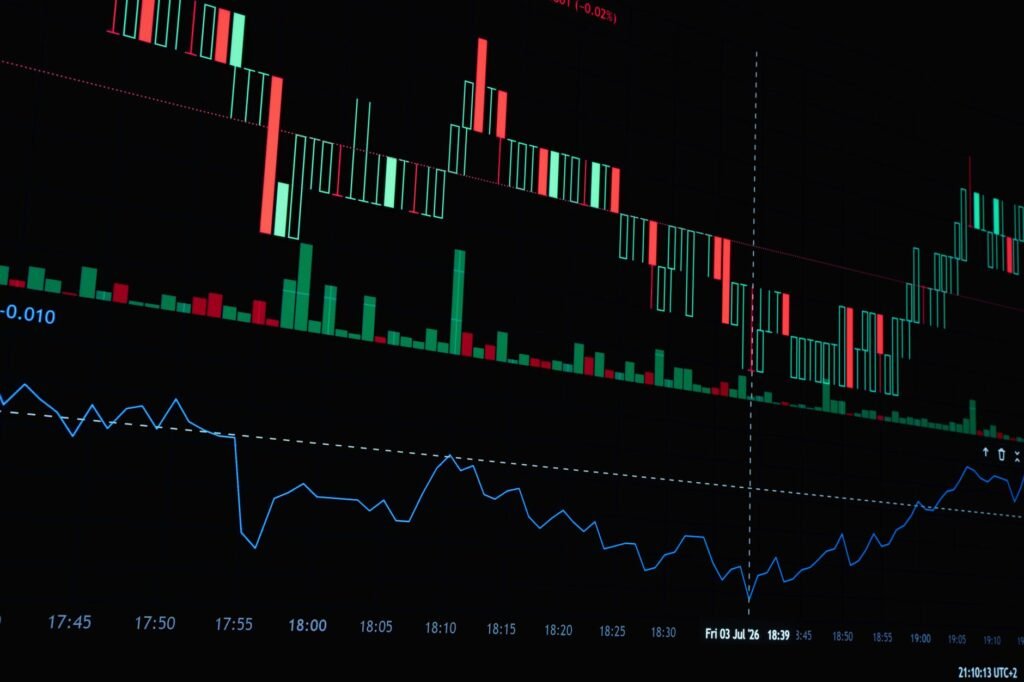

In the dynamic world of trading, understanding market psychology and the underlying forces of supply and demand is crucial. While price charts show where an asset has traded, and traditional volume bars indicate when volume occurred, Volume Profile offers a unique perspective: it reveals at which price levels the most volume has been transacted over a specified period. This article will define Volume Profile trading, break down its essential components, and explain how traders commonly interpret it to identify potential support and resistance zones.
Volume Profile is an advanced charting study that displays the total traded volume at specific price levels over a given time frame. Unlike conventional vertical volume bars that show total volume for each time increment (e.g., a 1-hour candle), Volume Profile presents a horizontal histogram on the side of the price chart, with longer bars indicating more trading activity at those price points. This visualization helps traders see areas where significant market participation occurred, suggesting points of agreement or disagreement between buyers and sellers.
Key Components of Volume Profile
To effectively interpret Volume Profile, understanding its core elements is essential:
- Value Area (VA): The Value Area represents the price range where a significant percentage of the total volume was traded during the specified period. Typically, this is set to 70% of the total volume. The Value Area highlights where the majority of market participants agreed on price, indicating a fair value zone for the asset.
- Volume Point of Control (VPOC): Often referred to as the ‘VPOC,’ this is the single price level within the Volume Profile where the highest amount of volume occurred. The VPOC is considered a fair value price or an equilibrium point, acting like a magnet for price. It often represents a significant level of support or resistance.
- High Volume Nodes (HVNs): These are price levels within the Volume Profile that exhibit a significantly high amount of traded volume, but are not the VPOC. HVNs indicate areas where the market spent a considerable amount of time consolidating or where a large number of trades were executed. These levels can act as strong zones of support (if price is above them) or resistance (if price is below them), as market participants who transacted there may defend their positions.
- Low Volume Nodes (LVNs): Conversely, Low Volume Nodes are price levels where very little volume was traded. These often appear as ‘gaps’ or ‘valleys’ in the Volume Profile. LVNs typically represent areas of rapid price movement, where the market quickly moved through without much conviction or consensus. Consequently, when price re-approaches an LVN, it may move through it quickly again, as there is less historical participation to act as support or resistance.
Interpreting Volume Profile for Trading Decisions
The primary utility of Volume Profile lies in its ability to help traders identify critical price levels where institutional and algorithmic activity likely occurred. In the current market environment of 2026, where digital transformation, AI integration across industries, and evolving central bank policies continue to shape asset valuations, understanding underlying market mechanics is paramount. Volume Profile offers a granular view into where significant capital has been committed, providing a potential edge in discerning areas of market conviction even amidst broader macroeconomic uncertainties.
Identifying Support and Resistance
One of the most common applications of Volume Profile is identifying potential support and resistance levels:
- HVNs and VPOC as Strong Levels: Price levels with high volume (HVNs and especially the VPOC) often act as robust support or resistance. If the price is approaching a prior HVN or VPOC from below, that level may act as resistance. Conversely, if the price is falling towards a prior HVN or VPOC, it could find support there. The idea is that many participants entered positions at these levels and may seek to defend them.
- LVNs as Weak Levels: Low Volume Nodes suggest areas where price moved quickly. When price returns to an LVN, it might pass through with relative ease, as there isn’t significant prior volume to provide strong support or resistance. Traders might view these as potential breakout or breakdown zones.
- Value Area Shifts: Monitoring how the Value Area shifts over time can provide insights into market sentiment. An upward shift in the Value Area suggests growing bullish conviction, while a downward shift indicates increasing bearishness. If price moves out of a previous Value Area and fails to return, it can signal a change in market equilibrium.
Market Structure and Trends
Volume Profile can also illuminate broader market structure. For instance, a profile with a large, bell-shaped distribution (indicating a wide Value Area) often suggests a period of consolidation or accumulation/distribution. A ‘P-shaped’ profile (volume concentrated at the top) might indicate a short squeeze or strong buying, while a ‘b-shaped’ profile (volume concentrated at the bottom) could suggest a long liquidation or strong selling. Understanding these shapes, especially in the context of recent market trends – such as sectors impacted by ongoing supply chain adaptations or shifts in global economic policy since 2023 – can offer deeper context.
Combining with Other Technical Tools
While Volume Profile is a powerful tool on its own, its effectiveness is often amplified when used in conjunction with other forms of technical analysis. For example:
- Confirming trend lines or moving average crossovers with significant volume at key profile levels.
- Using candlestick patterns to confirm price reactions at HVNs or the VPOC.
- Integrating with fundamental analysis to understand why certain price levels might be attracting significant interest in specific assets or sectors.
Practical Applications in Trading
Traders might utilize Volume Profile to strategize various aspects of their activity:
- Identifying Entry and Exit Points: A common approach involves looking for long entries when price finds support at an HVN or VPOC, or short entries when price meets resistance. Exit strategies might involve setting profit targets near the opposite side of a Value Area or an HVN.
- Managing Risk: Low Volume Nodes can be instrumental in defining stop-loss levels. If price breaks through a significant HVN or VPOC with conviction, it might signal a change in market structure, prompting a re-evaluation of a position.
- Assessing Trade Validity: A move above a resistance level (or below a support level) that is accompanied by strong volume at new, higher (or lower) price levels, as seen on the Volume Profile, can add confidence to the validity of the breakout or breakdown.
Volume Profile offers a robust analytical lens for dissecting market mechanics and understanding where the most significant activity has occurred. By interpreting its components – the Value Area, VPOC, HVNs, and LVNs – traders can gain valuable insights into potential support and resistance levels, and better understand market sentiment. While it is a sophisticated tool, it provides a unique perspective that can complement other trading strategies, aiding in the identification of high-probability trading setups. Remember, successful trading often involves a confluence of evidence, and Volume Profile is a powerful addition to a trader’s analytical toolkit.
Disclaimer: This article is provided for general informational and educational purposes only and does not constitute financial, investment, trading, or legal advice. Gainsium is not a registered investment advisor. Markets are volatile and past performance does not guarantee future results. Readers should conduct their own research and consult a licensed financial advisor before making any investment decisions.