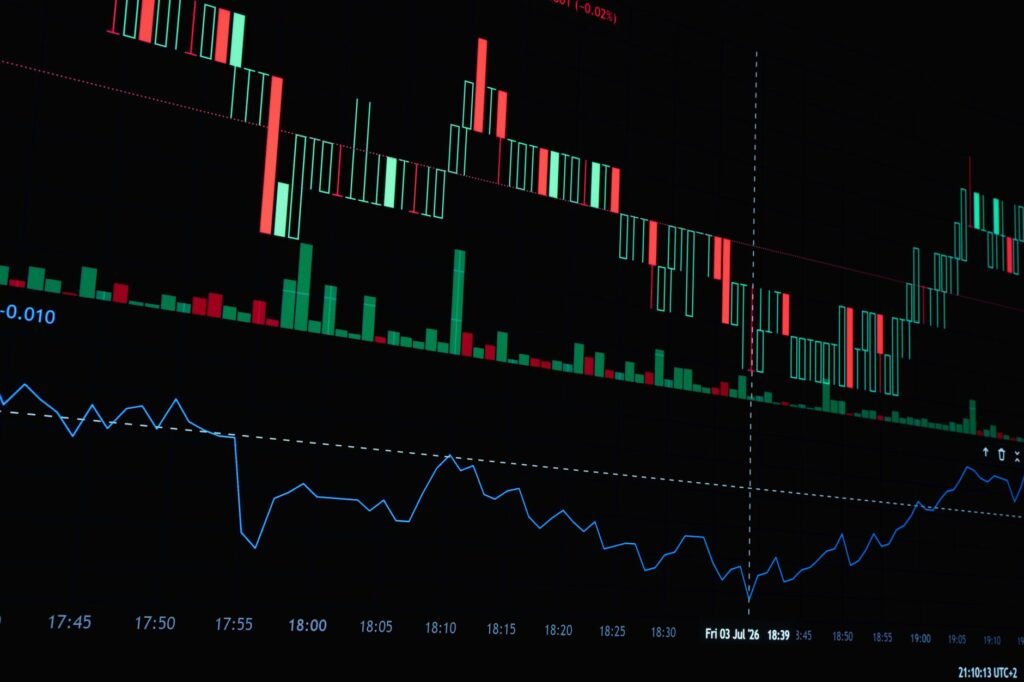

In the dynamic financial markets of 2026, discerning reliable trading signals is more crucial than ever. This guide provides a comprehensive overview of how to integrate volume data with other technical indicators, empowering traders to validate signals and refine their trade entry and exit strategies. Understanding how volume confirms price action is a fundamental skill that can significantly enhance a trader’s analytical toolkit.
Understanding Volume in Modern Markets
Trading volume represents the total number of shares, contracts, or units of a security traded over a specific period. It is a powerful, often underutilized, metric that provides insight into the conviction behind price movements. In 2026, with increasing market fragmentation, the prevalence of algorithmic trading, and continued participation from both institutional and retail investors, understanding volume’s true implications is paramount.
High volume often indicates strong interest and conviction, suggesting that a price movement is supported by significant market participation. Conversely, low volume can signal a lack of interest, indecision, or that a price move may not be sustainable. The core principle of volume analysis is simple: volume should generally confirm the direction and strength of price action. A significant price move on low volume might be viewed with skepticism, whereas a strong move on high volume offers greater confidence.
Integrating Volume with Key Technical Indicators
Volume analysis truly shines when combined with other well-established technical indicators. This synergistic approach helps filter out false signals and confirm legitimate trading opportunities.
Volume and Price Trends (Uptrends and Downtrends)
- Confirming an Uptrend: In a healthy uptrend, prices typically make higher highs and higher lows. For confirmation, each rally (price increase) should ideally be accompanied by increasing volume, indicating strong buying interest. Retracements (pullbacks) within the uptrend should occur on lower volume, suggesting that selling pressure is temporary or weak.
- Confirming a Downtrend: A valid downtrend is characterized by lower lows and lower highs. Each decline (price decrease) should ideally see increasing volume, indicating strong selling pressure. Counter-trend rallies within the downtrend should occur on lower volume, suggesting weak buying interest.
- Trend Exhaustion: Extremely high volume at the peak of an uptrend or the bottom of a downtrend, especially if followed by a reversal candle, can sometimes signal trend exhaustion and a potential reversal.
Volume and Breakouts/Breakdowns
Breakouts (when price moves above resistance) and breakdowns (when price moves below support) are significant events. Volume provides critical validation for these moves.
- Valid Breakout: A price breakout above a resistance level accompanied by significantly higher-than-average volume suggests strong conviction behind the move and increases the likelihood of a sustained advance. Without strong volume, a breakout may be a ‘false breakout’ or ‘fakeout.’
- Valid Breakdown: Similarly, a breakdown below a support level with a surge in volume indicates strong selling pressure and a higher probability of further declines. Low volume on a breakdown might suggest a temporary dip rather than a sustained move.
Volume and Reversals (Tops and Bottoms)
Identifying potential market reversals early can be highly advantageous. Volume often plays a role in signaling these turning points.
- Reversal at a Top: A market reaching new highs on declining volume, or an abrupt reversal following an extremely high-volume day (often called a ‘climax top’), can indicate a lack of buying conviction and a potential trend reversal to the downside.
- Reversal at a Bottom: A market making new lows on declining volume (indicating selling exhaustion), or a sharp bounce from a low accompanied by a significant increase in volume (often called a ‘climax bottom’), can suggest a potential trend reversal to the upside.
Volume and Support/Resistance Levels
When price approaches established support or resistance, volume can help gauge the strength of these levels.
- Holding Support/Resistance: If price approaches a support level and bounces off it on high volume, it suggests strong buying interest at that level. Conversely, if price approaches resistance and reverses on high volume, it implies strong selling pressure.
Advanced Volume Indicators for Signal Confirmation
Beyond simply observing raw volume bars, several sophisticated volume indicators offer deeper insights into market sentiment and can further confirm trading signals.
On-Balance Volume (OBV)
The On-Balance Volume (OBV) indicator is a momentum indicator that relates volume to price changes. It accumulates total volume on up days and subtracts total volume on down days. A rising OBV confirms an uptrend, while a falling OBV confirms a downtrend. Divergence between OBV and price (e.g., price making higher highs but OBV making lower highs) can be a strong leading signal of a potential reversal.
Volume-Weighted Average Price (VWAP)
The Volume-Weighted Average Price (VWAP) represents the average price of a security over a specified period, weighted by volume. It’s particularly useful for intraday traders and institutions. Trading above VWAP with rising volume can indicate strength, while trading below VWAP with rising volume can indicate weakness. VWAP can act as a dynamic support or resistance level, with significant volume around it confirming its importance.
Accumulation/Distribution Line (A/D Line)
The Accumulation/Distribution Line is another volume-based indicator designed to measure the cumulative flow of money into or out of a security. It essentially tries to determine if smart money is accumulating (buying) or distributing (selling) a stock. A rising A/D line, especially if it precedes a price increase, can signal accumulation, confirming a potential uptrend. Conversely, a falling A/D line can suggest distribution and a potential downtrend.
Practical Considerations for 2026 Traders
As markets continue to evolve in 2026, a few practical points are worth considering for effective volume analysis:
- Algorithmic Influence: Algorithmic trading now accounts for a significant portion of market volume. While this can sometimes create sudden volume spikes, the underlying principle of volume confirming price conviction remains relevant for understanding overall market sentiment. Traders adapt by focusing on sustained volume patterns rather than isolated bursts.
- Multi-Timeframe Analysis: Confirming signals across multiple timeframes (e.g., daily chart volume confirming an hourly chart signal) can add further conviction to trade decisions.
- Volume is a Confirmation Tool: Remember that volume analysis is best utilized as a confirmation tool, not a standalone strategy. It works most effectively when combined with price action analysis and other technical indicators like moving averages, trend lines, and candlestick patterns.
- Adaptability: Market characteristics can shift. Continuously evaluating how volume patterns correlate with price action in current market conditions is key to maintaining an edge.
By diligently applying volume analysis in conjunction with other technical tools, traders can significantly enhance their ability to identify high-probability trading signals and make more informed decisions regarding trade entry and exit points. It’s a critical component of a robust analytical framework.
Disclaimer: This article is provided for general informational and educational purposes only and does not constitute financial, investment, trading, or legal advice. Gainsium is not a registered investment advisor. Markets are volatile and past performance does not guarantee future results. Readers should conduct their own research and consult a licensed financial advisor before making any investment decisions.