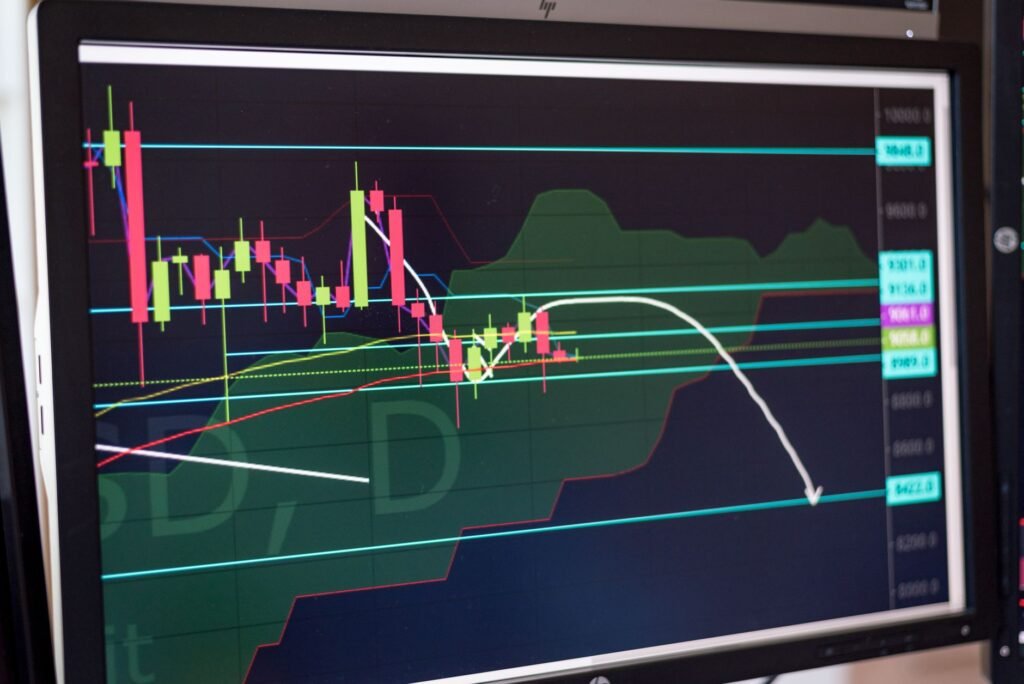

In the dynamic financial markets of 2026, understanding momentum indicators remains crucial for identifying potential trading opportunities. This guide delves into how to effectively interpret and utilize the Relative Strength Index (RSI) to generate actionable trading signals and identify prevailing market conditions. By leveraging the RSI, traders aim to gauge the speed and change of price movements, which can be instrumental in decision-making.
Understanding the Relative Strength Index (RSI)
The Relative Strength Index (RSI) is a widely used momentum oscillator developed by J. Welles Wilder Jr. It measures the speed and change of price movements, ranging from 0 to 100. Fundamentally, RSI attempts to illustrate the current and historical strength or weakness of a particular asset over a specific period, typically 14 trading periods. The indicator provides a visual representation of how enthusiastically an asset has been bought or sold, making it a valuable tool for discerning market sentiment.
How RSI is Calculated (Simplified)
While the exact formula involves multiple steps, the core idea behind RSI is to calculate the average gain during periods when prices closed higher and compare it to the average loss during periods when prices closed lower. This ratio is then smoothed and normalized into the 0-100 scale. A higher RSI value indicates that, on average, recent price gains have been more significant than losses, suggesting strong buying pressure. Conversely, a lower RSI value suggests stronger selling pressure.
Interpreting RSI: Overbought and Oversold Conditions
One of the primary uses of the RSI is to identify potential overbought and oversold market conditions. These are typically defined by specific thresholds:
- Overbought (RSI above 70): When the RSI rises above 70, it suggests that the asset may be overbought, meaning its price has increased rapidly and may be due for a pullback or consolidation.
- Oversold (RSI below 30): Conversely, when the RSI falls below 30, it indicates that the asset may be oversold, implying its price has fallen quickly and could be ripe for a rebound.
It is important to remember that these thresholds are not definitive buy or sell signals on their own. In strong upward trends, an asset can remain overbought for extended periods, and similarly, in strong downtrends, it can stay oversold. Traders often seek additional confirmation before acting on overbought or oversold readings.
Generating Trading Signals with RSI
Beyond simple overbought/oversold readings, the RSI can generate more nuanced trading signals when combined with other forms of analysis.
Divergence: A Key Signal
Divergence occurs when the price of an asset moves in one direction, but the RSI moves in the opposite direction. This often signals a potential trend reversal:
- Bullish Divergence: This occurs when the asset’s price makes a new lower low, but the RSI makes a higher low. It suggests that the selling momentum is weakening, and a price reversal to the upside may be imminent.
- Bearish Divergence: This occurs when the asset’s price makes a new higher high, but the RSI makes a lower high. It indicates that the buying momentum is fading, and a price reversal to the downside could be on the horizon.
Divergences are considered strong signals because they highlight a weakening of the underlying momentum supporting the current price trend.
RSI Centerline Crossovers
The 50-level on the RSI scale often acts as a centerline, indicating the general momentum bias:
- RSI above 50: Suggests that the average gains are outperforming average losses, indicating bullish momentum.
- RSI below 50: Indicates that average losses are exceeding average gains, pointing to bearish momentum.
A cross above the 50-level can signal strengthening bullish momentum, while a cross below can signal strengthening bearish momentum. Some traders use these crossovers as potential entry or exit points, especially in conjunction with other confirming indicators.
Advanced RSI Concepts and 2026 Market Context
In 2026, with the continued evolution of automated trading and vast data analysis capabilities, the application of indicators like RSI remains critical. Market conditions continue to be influenced by factors such as persistent inflationary pressures in some economies, evolving interest rate policies by central banks, and significant geopolitical shifts. Furthermore, the increasing integration of artificial intelligence in financial analytics means that market participants often have access to more sophisticated tools, making the mastery of foundational indicators even more valuable for differentiating one’s approach.
Combining RSI with Other Indicators
For more robust signals, it is a common practice to use RSI in conjunction with other technical analysis tools. For example, combining RSI with moving averages can help confirm trends, or using it alongside support and resistance levels can provide clearer entry and exit points. Volume analysis can also add conviction to RSI signals, with strong volume confirming a divergence or a breakout from overbought/oversold zones.
Adapting RSI Settings
While the 14-period setting is the default and most common, some traders adjust this parameter based on their trading style and the asset being analyzed. Shorter periods (e.g., 7-9) make the RSI more sensitive to price changes, resulting in more frequent overbought/oversold signals, which might suit short-term traders. Longer periods (e.g., 21-25) smooth out the indicator, generating fewer but potentially more reliable signals, favored by swing or position traders.
Limitations and Best Practices
Despite its utility, the RSI is not without limitations. It can sometimes generate false signals, especially in highly volatile or strongly trending markets where it may remain in overbought or oversold territory for extended periods without an immediate reversal. Therefore, solely relying on RSI for trading decisions is generally not advised.
Effective use of RSI involves:
- Confirmation: Always seek confirmation from other indicators, chart patterns, or fundamental analysis.
- Risk Management: Implement strict risk management strategies, including stop-loss orders, regardless of the strength of an RSI signal.
- Backtesting: Regularly backtest any RSI-based strategy on historical data relevant to the specific asset and timeframe to understand its efficacy under various market conditions.
- Market Context: Consider the broader market context, including economic news, industry trends, and overall market sentiment, as these can significantly impact asset prices and indicator reliability.
By understanding its nuances and employing it as part of a comprehensive trading strategy, traders in 2026 can leverage the Relative Strength Index to enhance their market analysis and potentially improve their decision-making process.
Disclaimer: This article is provided for general informational and educational purposes only and does not constitute financial, investment, trading, or legal advice. Gainsium is not a registered investment advisor. Markets are volatile and past performance does not guarantee future results. Readers should conduct their own research and consult a licensed financial advisor before making any investment decisions.