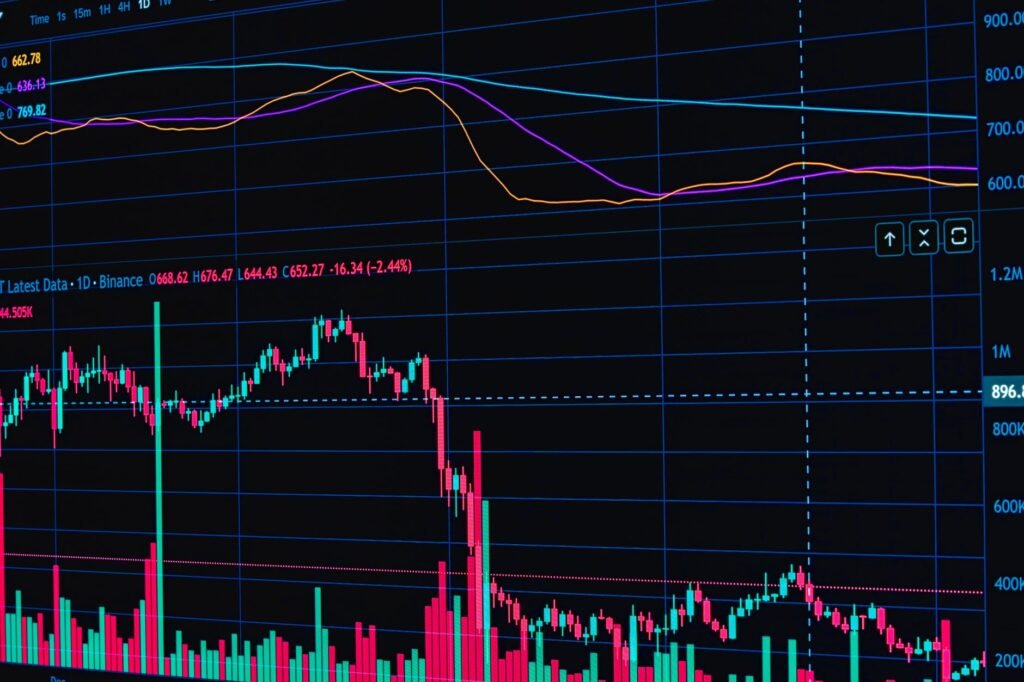

Understanding market trends is a cornerstone of effective trading, and for beginners, moving averages offer an accessible entry point into technical analysis. This guide will explore what moving averages are, how they function, and practical ways traders can utilize them to identify and confirm market trends.
What Are Moving Averages?
Moving averages are widely used technical indicators that smooth out price data over a specified period by creating a constantly updated average price. By doing so, they help to filter out short-term price fluctuations or ‘noise,’ making it easier to discern the underlying trend.
There are several types of moving averages, but the two most common for beginners are the Simple Moving Average (SMA) and the Exponential Moving Average (EMA).
Simple Moving Average (SMA)
The Simple Moving Average calculates the average price of an asset over a specific number of periods. For example, a 50-period SMA adds up the closing prices of the last 50 periods (e.g., 50 days if using daily charts) and divides the total by 50. Each new period, the oldest data point is dropped, and the newest is added, ensuring the average always reflects the most recent data set.
SMAs provide a clear, smooth representation of the average price, making them excellent for identifying long-term trends. However, their simplicity means they can be slow to react to rapid price changes.
Exponential Moving Average (EMA)
The Exponential Moving Average also calculates an average price, but it gives more weight to recent prices. This responsiveness makes the EMA a favorite among traders looking for indicators that react more quickly to current market movements. While an EMA might appear more volatile than an SMA of the same period, its quicker reaction time can be beneficial for identifying trend shifts sooner.
How Moving Averages Identify Trends
Moving averages are powerful tools for trend identification primarily because they act as trend filters and dynamic support/resistance levels. Traders typically use moving averages of different lengths to gain varied perspectives on market momentum.
Trend Direction and Strength
One of the most straightforward ways to use a moving average is to determine the prevailing trend direction.
- When the price of an asset is consistently above a moving average, it generally indicates an uptrend.
- Conversely, when the price is consistently below a moving average, it often signals a downtrend.
- If the price crosses above and below the moving average frequently, it suggests a sideways or consolidating market with no clear trend.
The slope of the moving average itself also provides clues: an upward-sloping moving average confirms an uptrend, while a downward-sloping one confirms a downtrend. A flatter moving average indicates a lack of strong directional momentum.
Crossovers: Signals for Change
Moving average crossovers are popular signals for potential trend changes or continuations. This strategy typically involves plotting two moving averages on the same chart: one with a shorter period (e.g., 20-period) and one with a longer period (e.g., 50-period or 200-period).
- A bullish crossover, often called a ‘golden cross,’ occurs when the shorter-period moving average crosses above the longer-period moving average. This is frequently interpreted as a signal that upward momentum is increasing and a new uptrend may be forming.
- A bearish crossover, known as a ‘death cross,’ happens when the shorter-period moving average crosses below the longer-period moving average. This often suggests that downward momentum is gaining strength, potentially signaling a new downtrend.
These crossover events are often closely watched by market participants, especially the 50-day and 200-day moving average crossovers, which have historically been significant indicators for major trend shifts in broader market indices.
Dynamic Support and Resistance
Moving averages can also function as dynamic levels of support and resistance. In an uptrend, prices may pull back to a moving average before bouncing higher, with the moving average acting as support. In a downtrend, prices may rally to a moving average before being rejected and moving lower, with the moving average acting as resistance.
For instance, the 200-day moving average is a widely observed long-term trend indicator. In 2026, as in previous years, many institutional investors and analysts continue to monitor this average to gauge the health of a market or individual asset. When an asset finds consistent support at its 200-day SMA, it can reinforce a long-term bullish outlook, while a sustained break below it may signal long-term weakness.
Applying Moving Averages in Practice
While moving averages are powerful, their effectiveness is enhanced when used thoughtfully and in conjunction with other tools. Gainsium reminds its readers that this content is for general education and not personalized financial advice.
Selecting the Right Period
The choice of moving average period depends on the trader’s objectives and the timeframe they are analyzing.
- Short-term traders might use 10-period or 20-period moving averages to identify quick trend changes.
- Swing traders often prefer 50-period moving averages for intermediate trends.
- Long-term investors typically look at 100-period or 200-period moving averages for major market trends.
Experimenting with different periods on historical data can help a trader understand which settings best suit their trading style and the specific asset being analyzed.
Integrating with Other Indicators
Moving averages provide excellent insights into trends, but they can generate false signals, especially in choppy or consolidating markets. To improve reliability, traders often combine moving averages with other technical indicators. For example:
- Volume indicators: Increased volume accompanying a moving average crossover can lend more credibility to the signal.
- Oscillators (e.g., RSI, MACD): These can help confirm overbought or oversold conditions, or divergence from price action, providing additional context to moving average signals.
- Support and Resistance levels: Traditional horizontal support and resistance levels can offer additional confirmation when they align with dynamic moving average levels.
Considerations for the Current Market Landscape (2026)
In 2026, market participants continue to navigate a complex global economic environment. Factors such as persistent inflation concerns in various regions, evolving central bank monetary policies, and the rapid advancements in artificial intelligence (AI) influencing market data analysis are all widely discussed topics. The rise of digital assets also remains a significant development, with many traditional technical analysis tools, including moving averages, being applied to this nascent asset class.
As always, historical performance is not indicative of future results. While moving averages provide a framework for trend analysis, the dynamic nature of markets, especially with ongoing technological shifts and geopolitical developments, means traders must adapt their approach and remain informed. Staying abreast of macroeconomic reports and sector-specific news, alongside technical analysis, is crucial. Traders might also observe how different asset classes react to their respective moving averages; for instance, commodities, equities, and cryptocurrencies often display unique characteristics in their trend behaviors.
Conclusion
Moving averages are fundamental tools in a trader’s arsenal for identifying and confirming market trends. By smoothing price data and offering clear visual representations of underlying momentum, they empower beginners to make more informed decisions. Whether utilizing SMAs for long-term perspectives or EMAs for quicker reactions, understanding their application, coupled with careful selection of periods and integration with other indicators, can significantly enhance a trader’s ability to navigate the complexities of financial markets.
Disclaimer: This article is provided for general informational and educational purposes only and does not constitute financial, investment, trading, or legal advice. Gainsium is not a registered investment advisor. Markets are volatile and past performance does not guarantee future results. Readers should conduct their own research and consult a licensed financial advisor before making any investment decisions.