
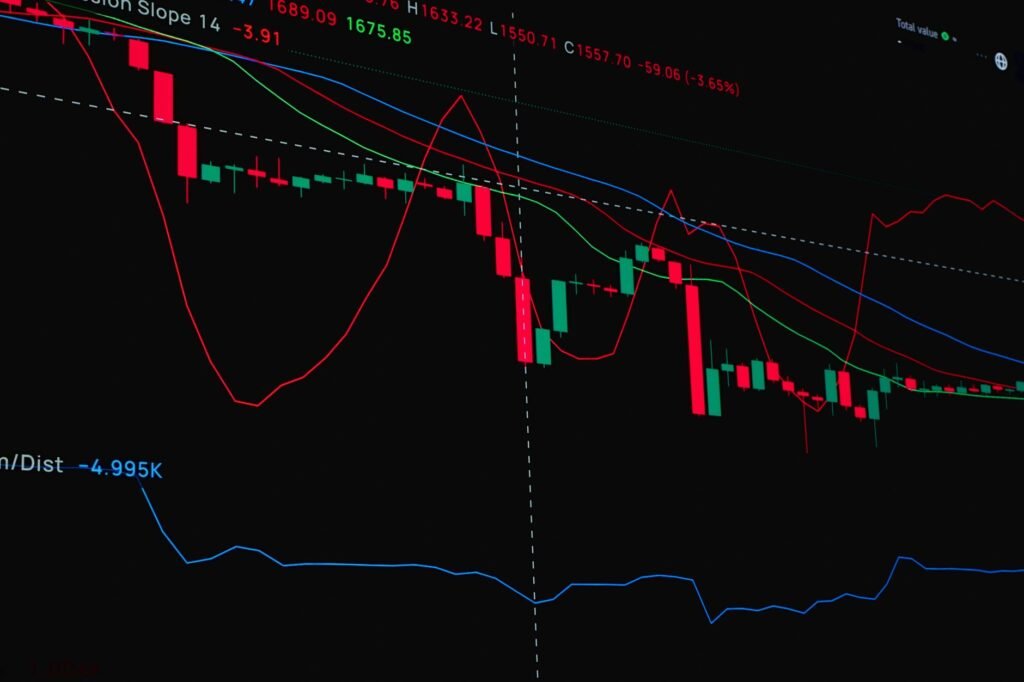

Understanding how to identify market trends is a foundational skill for any trader. In 2026, with dynamic market conditions driven by evolving global economics and technological shifts, the ability to clearly discern trend direction remains paramount. This guide will teach traders how to effectively apply different types of moving averages to their charts, interpret their signals, and use them to identify market trends for more informed decision-making.
Understanding Moving Averages: The Foundation of Trend Analysis
Moving averages (MAs) are widely utilized technical indicators that smooth out price data over a specific period, creating a single, flowing line. This smoothing helps to filter out ‘noise’ from daily price fluctuations, making it easier to see the underlying trend. They are lagging indicators, meaning they reflect past price action rather than predicting future movements, but they are invaluable for confirming existing trends and identifying potential reversals.
Simple Moving Average (SMA)
The Simple Moving Average (SMA) is the most basic type of moving average. It calculates the average price of an asset over a specified number of periods. For example, a 50-day SMA calculates the average closing price over the past 50 trading days. Each day, the oldest price is dropped, and the newest price is added to the calculation, causing the average to ‘move’.
- Calculation: Sum of closing prices over ‘n’ periods / ‘n’
- Characteristics: SMAs are slower to react to price changes due to their equal weighting of all data points within the period. This makes them ideal for identifying longer-term trends but potentially less responsive to immediate shifts.
- Application: Often used for major trend identification on daily or weekly charts, such as the 200-day SMA for assessing long-term market sentiment.
Exponential Moving Average (EMA)
The Exponential Moving Average (EMA) is a variation of the SMA that places greater weight on more recent price data. This weighting makes the EMA more responsive to current market changes than the SMA, allowing it to turn quicker and provide earlier signals.
- Calculation: More complex, involving a smoothing factor, but conceptually it prioritizes recent prices.
- Characteristics: EMAs react faster to price shifts, which can be beneficial in volatile markets or for shorter-term trading strategies. However, this increased sensitivity can also lead to more false signals during choppy periods.
- Application: Popular for shorter to medium-term trend analysis and for generating trade signals, such as 12-day and 26-day EMAs often used in conjunction for MACD calculations.
Key takeaway: The choice between SMA and EMA often depends on a trader’s preferred timeframe and sensitivity to price changes. Some traders might prefer the smoothness of an SMA for long-term views, while others might opt for the responsiveness of an EMA for capturing shorter-term dynamics.
Applying Moving Averages for Effective Trend Identification
Once you understand the different types of moving averages, the next step is to apply them to identify market trends effectively. Moving averages provide visual cues on charts that can signal trend direction, strength, and potential turning points.
Identifying Trends with Single Moving Averages
A fundamental way to use a single moving average is to observe its relationship with the asset’s price and its slope:
- If the price is consistently trading above a moving average (e.g., a 50-day or 200-day MA), it generally indicates an uptrend.
- If the price is consistently trading below a moving average, it generally signals a downtrend.
- The slope of the moving average itself can indicate trend strength: an upward-sloping MA suggests a strong uptrend, while a downward-sloping MA points to a strong downtrend. A flat MA suggests a sideways or consolidating market.
Moving averages can also act as dynamic support and resistance levels. In an uptrend, the price may pull back to the MA and then bounce higher, with the MA serving as a support level. Conversely, in a downtrend, the price might rally to the MA and then fall back, with the MA acting as a resistance level. Observing these interactions can help confirm the ongoing trend.
Cross-Over Strategies: Multiple Moving Averages
One of the most popular and straightforward methods for trend identification and signal generation involves using two or more moving averages. The interaction between a shorter-term MA and a longer-term MA can provide powerful trend signals.
- Golden Cross: This is a bullish signal that occurs when a shorter-term moving average (e.g., 50-period MA) crosses above a longer-term moving average (e.g., 200-period MA). It suggests that recent positive momentum is overcoming the longer-term trend, potentially signaling the start of an uptrend.
- Death Cross: Conversely, this is a bearish signal that occurs when a shorter-term moving average crosses below a longer-term moving average. It indicates that recent negative momentum is prevailing, potentially signaling the start of a downtrend.
While these crosses are widely watched, especially the 50-day and 200-day MA crosses on daily charts, it’s important to remember they are lagging indicators. By 2026, with the rapid dissemination of information and algorithmic trading, these signals may already reflect established trends rather than predicting fresh turns. They are best used as confirmations rather than primary initiators of action.
Advanced Considerations and Best Practices for 2026 Traders
In the dynamic market environment of 2026, characterized by ongoing technological advancements, global economic shifts, and potential geopolitical volatility, refining your approach to moving averages can enhance their utility. While MAs are timeless tools, their application benefits from thoughtful consideration of current market characteristics.
Timeframes and Period Selection
The effectiveness of a moving average largely depends on the timeframe you are analyzing and the period you select for the MA. Shorter periods (e.g., 10 or 20) are more sensitive and suitable for short-term traders or highly volatile assets, while longer periods (e.g., 100 or 200) are better for identifying overarching trends favored by long-term investors. In 2026, traders might find themselves adjusting MA periods more frequently in response to varying market liquidity or sudden shifts in sentiment driven by macro news or innovative sector developments.
Combining MAs with Other Indicators
Moving averages alone are powerful, but their signals can be significantly strengthened when combined with other technical indicators. Since MAs are lagging, using them with leading indicators or momentum oscillators can provide a more comprehensive view. For example:
- Volume: A trend confirmed by MA crosses is more robust if accompanied by increasing volume.
- Relative Strength Index (RSI) or Stochastic Oscillator: These can help identify overbought or oversold conditions, suggesting potential reversals around MA support/resistance levels.
- MACD (Moving Average Convergence Divergence): MACD itself is derived from EMAs and provides insights into momentum and trend changes.
This multi-indicator approach helps filter out false signals and provides confirmation, which is crucial in potentially choppy markets.
Limitations and Pitfalls
It is important for traders to acknowledge the limitations of moving averages:
- Lagging Nature: MAs react to past price action, meaning they will always be behind the current price. This can lead to delayed signals, especially in fast-moving markets.
- Whipsaws in Choppy Markets: In sideways or trendless markets, MAs can generate numerous false signals (whipsaws) as prices repeatedly cross above and below them. This often leads to poor trading decisions if not combined with other confirmation tools.
- Not Predictive: MAs indicate what has happened and the current direction of momentum; they do not predict future price levels or guarantee specific outcomes.
As Gainsium is not a registered investment advisor, it is important to reiterate that this information is for general education. While moving averages offer a robust framework for trend identification, their successful application requires continuous learning, adaptation to evolving market structures, and rigorous risk management. In 2026 and beyond, market participants utilizing these tools effectively will likely be those who understand their strengths and weaknesses, integrating them into a broader analytical framework. Income potential from trading varies widely based on experience, market conditions, and time invested, and past performance is not indicative of future results.
Disclaimer: This article is provided for general informational and educational purposes only and does not constitute financial, investment, trading, or legal advice. Gainsium is not a registered investment advisor. Markets are volatile and past performance does not guarantee future results. Readers should conduct their own research and consult a licensed financial advisor before making any investment decisions.


