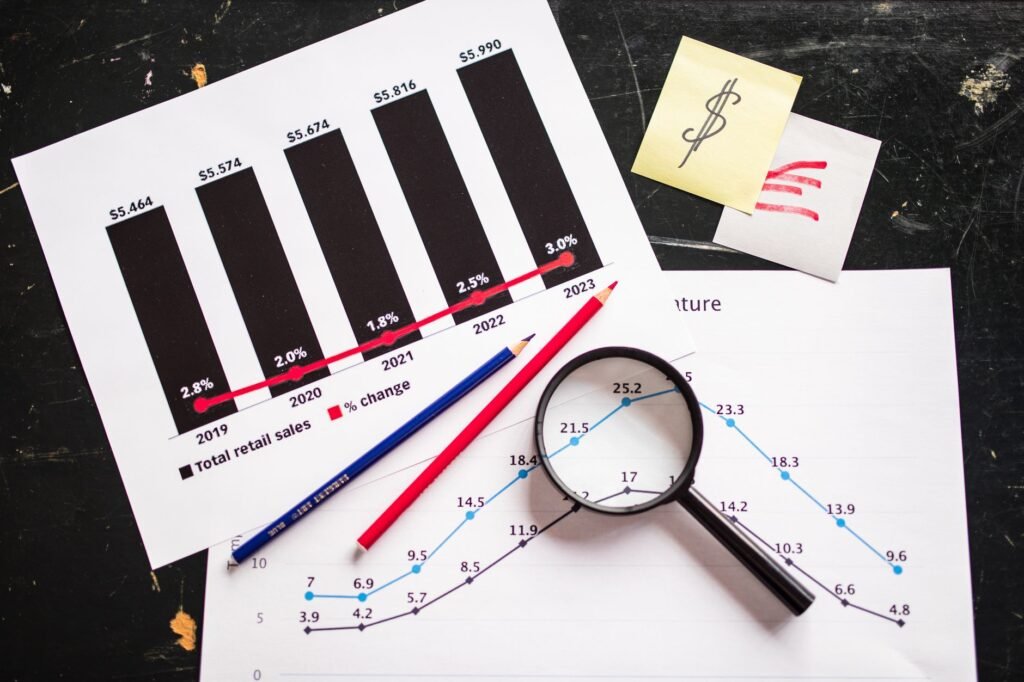

The Gross Domestic Product (GDP) report is a critical indicator for understanding the health and direction of an economy. For individuals seeking to make informed decisions about market trends and economic outlooks, especially looking ahead to 2026, knowing how to interpret these reports is fundamental. This guide will demystify GDP reports, explain their core components, and illustrate how their analysis contributes to broader economic forecasting.
Understanding Gross Domestic Product
Gross Domestic Product (GDP) represents the total monetary value of all finished goods and services produced within a country’s borders in a specific time period, typically a quarter or a year. It serves as a comprehensive scorecard for a nation’s economic health, reflecting its productivity and overall economic activity.
Nominal vs. Real GDP
- Nominal GDP measures economic output using current market prices. This means it can increase due to either an increase in the quantity of goods and services produced or an increase in prices (inflation).
- Real GDP adjusts for inflation, providing a more accurate picture of economic growth by measuring output in constant prices. It reflects actual increases in production rather than just price increases, making it the preferred measure for assessing true economic expansion.
As 2026 progresses, the distinction between nominal and real GDP is particularly relevant given ongoing discussions around inflation dynamics. Understanding which measure is being reported is crucial for accurate economic assessment.
The Components of GDP: The Expenditure Approach
GDP is most commonly calculated using the expenditure approach, which sums up all spending on final goods and services in an economy. This approach breaks GDP down into four main components, often represented by the formula: GDP = C + I + G + NX.
C: Personal Consumption Expenditures
This is typically the largest component of GDP, reflecting the total spending by households on goods (durable and non-durable) and services. Strong consumer spending indicates consumer confidence and robust demand within the economy. Trends in consumption are closely watched by analysts, as shifts here can significantly impact overall economic growth.
I: Gross Private Domestic Investment
Investment includes business spending on capital goods (like machinery and factories), residential construction, and changes in inventories. This component is highly sensitive to interest rates, business confidence, and future economic expectations. A surge in investment often signals businesses anticipating future growth and expanding their capacity.
G: Government Consumption Expenditures and Gross Investment
This component includes spending by federal, state, and local governments on goods and services, such as defense, infrastructure projects, and salaries for public employees. It excludes transfer payments like social security, which do not represent production of new goods or services. Government spending can provide a stable base for GDP, especially during periods when other components might falter.
NX: Net Exports (Exports – Imports)
Net exports represent the value of a country’s total exports (domestically produced goods and services sold abroad) minus its total imports (foreign-produced goods and services purchased domestically). A positive net export figure (a trade surplus) adds to GDP, while a negative figure (a trade deficit) subtracts from it. In 2026, global trade dynamics and supply chain resilience continue to be significant factors influencing this component for many economies.
Analyzing GDP Reports for Forecasting
When a GDP report is released, it’s not enough to just look at the headline number. A deeper dive into its components and related metrics offers more nuanced insights for economic forecasting.
Growth Rates and Contributions
Analysts typically focus on the quarterly annualized growth rate of real GDP. A positive growth rate indicates expansion, while a negative rate signals contraction. Equally important is understanding which components contributed most to the growth or decline. For instance, if consumption is strong but investment is weak, it might suggest a short-term boost rather than sustainable long-term expansion.
GDP Revisions
The Bureau of Economic Analysis (BEA) in the U.S. releases three estimates for each quarter: an “advance” estimate, a “second” estimate, and a “third” (or “final”) estimate. Significant revisions between these estimates can alter the perception of economic momentum. It is important to note that the initial reports are based on incomplete data, and subsequent revisions often provide a more accurate picture.
The GDP Deflator and Inflation
The GDP deflator is a measure of the average level of prices of all new, domestically produced, final goods and services in an economy. It is a broad measure of inflation and can be used to convert nominal GDP into real GDP. Monitoring the deflator in conjunction with other inflation metrics offers a comprehensive view of price stability and inflationary pressures, which remain a key focus for central banks globally in 2026.
GDP in the Broader 2026 Economic Landscape
GDP reports provide a snapshot, but their true value in forecasting comes from connecting them to other economic indicators and broader market trends. A holistic view is essential in 2026’s complex global economic outlook.
Connecting GDP to Other Indicators
- Employment Data: A growing GDP often correlates with robust job creation, indicating a strong labor market. Conversely, persistent unemployment can signal underlying weaknesses not immediately apparent in headline GDP figures.
- Inflation and Interest Rates: Central banks often use GDP growth as one input for monetary policy decisions. Strong GDP growth might lead to concerns about overheating and potential interest rate hikes, while sluggish growth could prompt rate cuts or other accommodative policies.
- Corporate Earnings: Sustainable GDP growth generally translates into better corporate earnings, which can support equity market performance. Sectoral GDP breakdowns can highlight industries poised for growth or facing headwinds.
Widely Reported Trends in 2026
The global economic landscape in 2026 continues to be shaped by several widely reported trends:
- Technological Innovation: Advancements in AI, automation, and digital transformation continue to drive productivity gains and shape labor market demands.
- Supply Chain Resilience: Efforts to diversify supply chains and regionalize production remain a focus, impacting trade patterns and investment.
- Green Energy Transition: Increased investment in renewable energy infrastructure and sustainable technologies drives capital expenditure and government spending.
- Demographic Shifts: Aging populations influence consumption patterns, labor supply, and government social service spending.
Understanding how these trends influence GDP components, such as increased investment in green energy boosting ‘I’ or tech adoption impacting ‘C’, enhances forecasting accuracy.
How Investors Utilize GDP Data
Investors do not use GDP data as a direct signal to buy or sell specific assets. Instead, it provides context for their overall macroeconomic outlook. A sustained period of strong GDP growth might suggest a favorable environment for risk assets like equities, while an impending slowdown could lead some to consider more defensive positions or re-evaluate sector allocations. It helps in assessing the broader economic tide against which individual investment strategies are formulated.
Limitations of GDP for Forecasting
While invaluable, GDP is not a perfect measure and has its limitations as a standalone forecasting tool.
- Lagging Indicator: GDP data reflects past economic activity, released well after the quarter has ended. It is often combined with forward-looking indicators for a comprehensive view.
- Incomplete Scope: The informal economy, unpaid household work, and volunteer services are typically excluded, potentially understating actual economic output.
- Quality vs. Quantity: GDP measures output but does not account for quality of life, income inequality, environmental sustainability, or overall well-being.
- Revisions: Initial GDP estimates are subject to potentially substantial revisions, altering the perception of economic momentum.
Conclusion
Interpreting GDP reports effectively is a crucial skill for anyone looking to understand economic trends and inform their financial perspective in 2026 and beyond. By delving beyond the headline numbers to analyze the individual components of consumption, investment, government spending, and net exports, observers can gain a more comprehensive understanding of economic drivers. While not a perfect or forward-looking indicator, when combined with other data and an awareness of prevailing global economic trends, GDP reports offer foundational insights for broader economic forecasting.
Disclaimer: This article is provided for general informational and educational purposes only and does not constitute financial, investment, trading, or legal advice. Gainsium is not a registered investment advisor. Markets are volatile and past performance does not guarantee future results. Readers should conduct their own research and consult a licensed financial advisor before making any investment decisions.