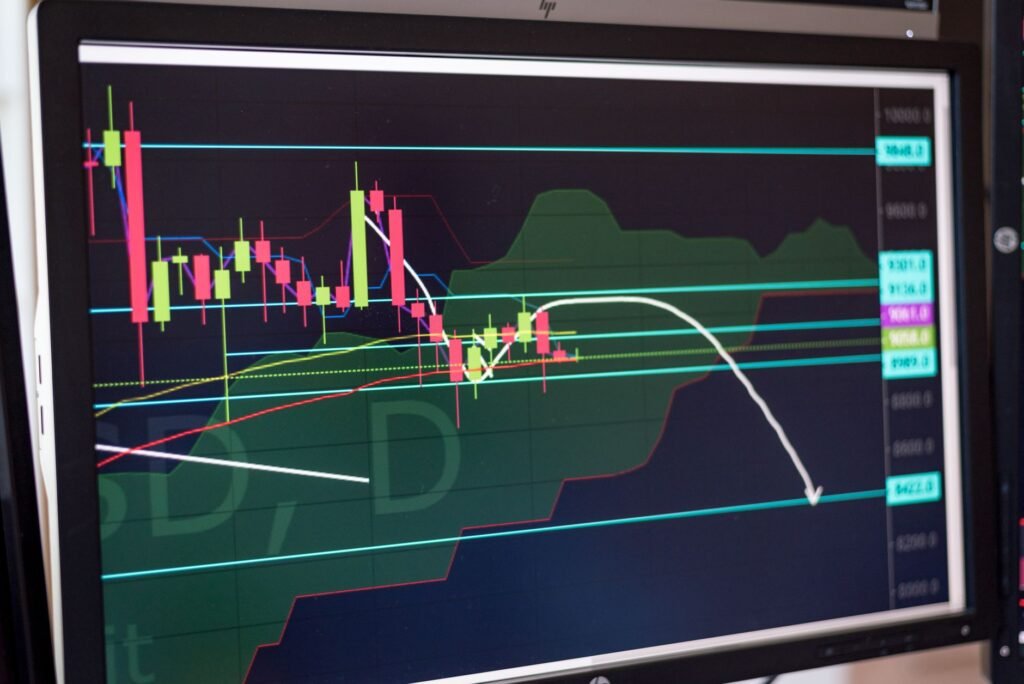

Understanding how to identify support and resistance levels is a foundational skill for anyone involved in trading. These critical price zones often dictate market movements, providing valuable insights for potential entry and exit points. In 2026, as markets continue to evolve with increased technological integration and global economic shifts, mastering these technical analysis pillars remains as relevant as ever for navigating various asset classes effectively.
Support and resistance levels are not just arbitrary lines on a chart; they represent crucial psychological thresholds where buying or selling interest has historically overcome the opposing force. Recognizing these zones can empower traders to make more informed decisions, regardless of whether they are analyzing equities, cryptocurrencies, commodities, or forex pairs.
What Are Support and Resistance Levels?
At its core, support is a price level where a downtrend is expected to pause due to a concentration of demand. When a price falls to a support level, buyers tend to enter the market, preventing the price from falling further. Think of it as a ‘floor’ that the price struggles to break through.
Conversely, resistance is a price level where an uptrend is expected to pause due to a concentration of supply. When a price rises to a resistance level, sellers tend to enter the market, preventing the price from rising higher. This acts like a ‘ceiling’ that the price finds difficult to penetrate.
These levels are dynamic, not static. Once a support level is decisively broken, it often transforms into a new resistance level. Similarly, a broken resistance level can become a new support level. This phenomenon is known as polarity change and is a vital concept for traders to grasp.
Why Are Support and Resistance Important in 2026?
In the current market environment of 2026, characterized by persistent macroeconomic influences such as ongoing interest rate adjustments, shifting global supply chains, and rapid technological advancements, understanding support and resistance is more crucial than ever. These levels provide a framework for:
- Trend Confirmation: They help confirm the strength and direction of a trend. A price consistently bouncing off support in an uptrend, or resistance in a downtrend, indicates the trend’s resilience.
- Entry and Exit Points: Traders often look for opportunities to buy near support levels and sell near resistance levels. For instance, a rebound from a strong support level might signal a buying opportunity.
- Risk Management: Support and resistance levels are instrumental in setting stop-loss orders. Placing a stop-loss just below a support level (for a long position) or just above a resistance level (for a short position) can help limit potential losses if the market moves against the trade.
- Market Structure Analysis: They offer insights into market sentiment and behavior. Repeated tests of a level without a breakthrough signal market indecision or a strong conviction at that price point.
Key Methods for Identifying Support and Resistance
Identifying these levels is a skill honed through practice and the application of various technical analysis tools. Here are some of the most common and effective methods:
1. Historical Price Action (Swing Highs and Lows)
The most fundamental way to identify support and resistance is by looking at past price movements. Areas where the price previously reversed are strong candidates. Chart patterns indicating past tops (swing highs) and bottoms (swing lows) often serve as future resistance and support, respectively.
- Swing Lows: The lowest point a price reaches before reversing upwards often becomes a support level.
- Swing Highs: The highest point a price reaches before reversing downwards often becomes a resistance level.
Multiple touches of a specific price area increase its significance as a support or resistance zone.
2. Trendlines
Trendlines connect a series of either higher lows (for an uptrend) or lower highs (for a downtrend). A rising trendline can act as dynamic support, while a falling trendline can act as dynamic resistance. The more times the price touches and respects a trendline, the stronger its validity.
3. Moving Averages
Moving averages (MAs) are widely used as dynamic support and resistance. Common MAs include the 50-period, 100-period, and 200-period simple or exponential moving averages. As the price approaches a significant moving average, it may either bounce off it (acting as support/resistance) or break through it, signaling a potential shift in trend. In 2026, with the prevalence of algorithmic trading, these widely observed technical indicators can sometimes trigger automated buying or selling responses.
4. Fibonacci Retracement Levels
Fibonacci retracement levels (23.6%, 38.2%, 50%, 61.8%, and 78.6%) are horizontal lines that indicate where support and resistance are likely to occur. These are drawn between two extreme points (a significant swing high and a swing low) and are based on the mathematical ratios observed in nature. Many traders use these levels to anticipate pullbacks within a trend, looking for price reversals at these specific percentages.
5. Psychological Levels (Round Numbers)
Round numbers (e.g., $10, $50, $100, $1,000) often act as psychological support and resistance levels. This is because many traders and institutional investors tend to place orders at these easily remembered price points. For instance, a stock trading near $99.50 might face significant resistance at the $100 mark as sellers place orders there.
Considerations for Identifying Levels in 2026
The global financial landscape in 2026 presents specific dynamics that can influence the behavior of support and resistance levels:
- Increased Volatility: Periods of heightened market volatility, often influenced by geopolitical events or shifts in central bank policies, can lead to quicker breaches of established levels. Traders might need to adjust their analysis to account for wider price swings.
- Algorithmic Trading: The continued rise of high-frequency and algorithmic trading means that some support and resistance levels might be tested and broken with greater speed, or respected with higher precision, as automated systems react instantly to price action around these key areas.
- Data Overload: While more data is available than ever, the ability to discern truly significant levels from minor fluctuations becomes crucial. Focusing on longer timeframes and combining multiple identification methods can help filter out market noise.
- Cross-Asset Correlation: In a highly interconnected global economy, movement in one asset class (e.g., commodities) can influence another (e.g., equities). Understanding broader market sentiment and inter-market analysis can provide additional context for the strength or weakness of specific support and resistance levels.
Using Support and Resistance in Your Trading Strategy
Once identified, support and resistance levels can be integrated into various trading strategies:
- Bounce Trading: This involves buying when the price bounces off a support level or selling when it rejects a resistance level. This strategy is best used in trending or ranging markets.
- Breakout Trading: This involves entering a trade when the price decisively breaks through a significant support or resistance level. A successful breakout suggests that the previous ‘floor’ or ‘ceiling’ has been overcome, potentially signaling the start of a new trend or the continuation of an existing one with renewed momentum. Confirmation of a breakout often involves the price closing beyond the level, ideally with increased volume.
- Confluence: Look for areas where multiple indicators or methods align. For example, if a historical swing low, a Fibonacci retracement level, and a major moving average all converge at a similar price point, that area could represent a particularly strong support or resistance zone.
Remember that no single indicator or method is foolproof. Combining several techniques for identifying support and resistance, alongside broader market analysis and a robust risk management plan, is generally recommended for navigating the complexities of trading.
Disclaimer: This article is provided for general informational and educational purposes only and does not constitute financial, investment, trading, or legal advice. Gainsium is not a registered investment advisor. Markets are volatile and past performance does not guarantee future results. Readers should conduct their own research and consult a licensed financial advisor before making any investment decisions.