
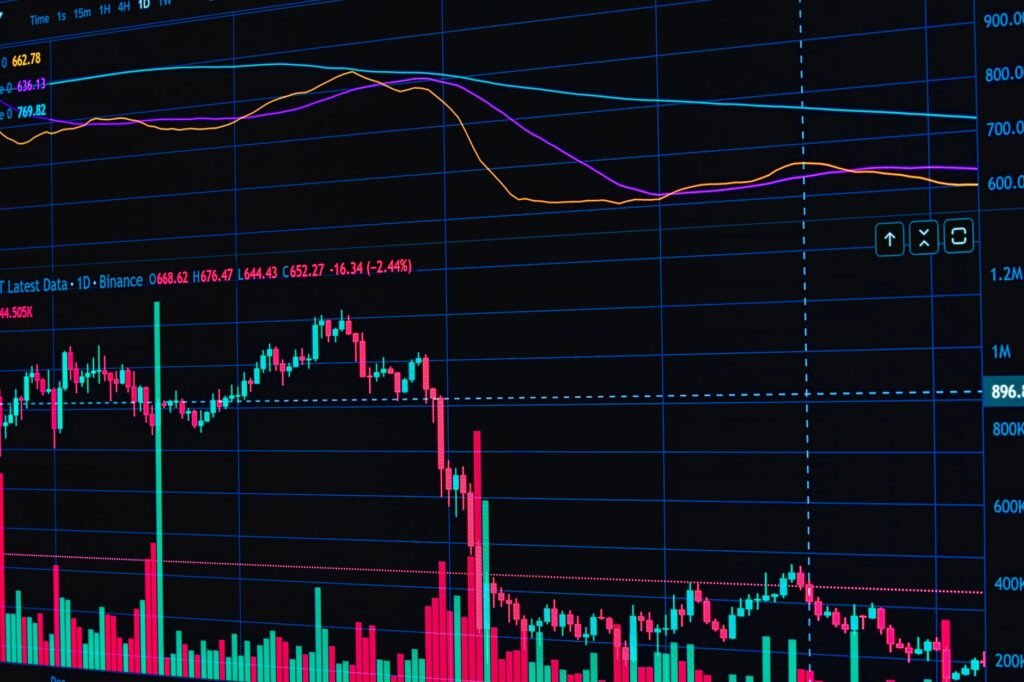

In the dynamic world of financial markets, understanding chart patterns can be a crucial skill for traders. When faced with volatile conditions, a common challenge arises: which patterns offer more reliable signals—continuation patterns or reversal patterns? For those navigating choppy markets, distinguishing between these two fundamental categories of technical analysis is essential for identifying potential trading opportunities and managing risk effectively.
Understanding Chart Patterns in Volatile Markets
Market volatility, characterized by rapid and often unpredictable price swings, has become a persistent feature of the financial landscape in recent years, including into 2026. Factors such as evolving geopolitical tensions, shifting monetary policies globally, and the rapid pace of technological innovation continue to create an environment where prices can swing dramatically. In such conditions, chart patterns serve as visual representations of market psychology, offering clues about potential future price direction. They help traders interpret supply and demand dynamics, indicating whether the current trend is likely to persist or reverse.
The Role of Technical Analysis
Technical analysis is the study of past market data, primarily price and volume, to forecast future price movements. Chart patterns are a cornerstone of this discipline, providing visual heuristics that represent collective market behavior. While no pattern guarantees future outcomes, understanding their characteristics can enhance decision-making by offering probabilities rather than certainties. It’s about building a framework for expectation, not predicting specific price points.
Decoding Continuation Patterns
Continuation patterns suggest that a temporary pause in the prevailing trend is underway, after which the original trend is expected to resume. These patterns typically form during periods of consolidation, where buyers and sellers are temporarily in balance, before one side eventually regains control and pushes prices in the original direction. Identifying them correctly can help traders position themselves to ride an existing trend.
Flags and Pennants
- Description: Flags are characterized by a short, sharp counter-trend movement resembling a small rectangle or parallelogram, following a significant price move (the “flagpole”). Pennants are similar but form a small symmetrical triangle.
- Identification: Look for a strong, almost vertical price surge or drop, followed by a brief, often shallow consolidation phase against the primary trend. Volume typically decreases during the pattern formation and expands upon breakout.
- Trading Strategy: Traders often look to enter a position in the direction of the original trend once the price breaks out of the flag or pennant formation. The projected price target is often estimated by measuring the length of the “flagpole” and adding it to the breakout point.
Triangles (Symmetrical, Ascending, Descending)
- Description: Triangles are formed by converging trendlines. Symmetrical triangles show neither buyers nor sellers are in control, with price making lower highs and higher lows. Ascending triangles have a flat top and rising bottom, indicating buyer strength. Descending triangles have a flat bottom and falling top, indicating seller strength.
- Identification: Observe price consolidating within two converging trendlines. The breakout direction often aligns with the preceding trend.
- Trading Strategy: Entry is typically initiated upon a clear breakout above the upper trendline (for an upward continuation) or below the lower trendline (for a downward continuation), ideally accompanied by increased volume. Stop-loss orders are commonly placed just inside the pattern.
Navigating Reversal Patterns
Reversal patterns signal that the current trend is likely to change direction. These formations indicate a significant shift in market sentiment, where the dominant forces (buyers or sellers) are losing momentum, and the opposing forces are gaining strength. Recognizing reversal patterns can help traders exit existing positions or initiate new ones in anticipation of a new trend.
Head and Shoulders (and Inverse Head and Shoulders)
- Description: A “Head and Shoulders” pattern, typically seen in uptrends, consists of three peaks: a higher middle peak (the “head”) and two lower peaks on either side (the “shoulders”). An “Inverse Head and Shoulders” pattern is its bullish counterpart, appearing in downtrends.
- Identification: The pattern is confirmed when the price breaks below the “neckline” (a line connecting the lows between the shoulders and the head). For inverse patterns, it’s a breakout above the neckline.
- Trading Strategy: Upon a confirmed neckline break, traders might consider initiating a position in the new trend direction. A common target measurement is the vertical distance from the head to the neckline, projected from the breakout point.
Double Tops and Double Bottoms
- Description: A Double Top forms after an uptrend, featuring two distinct peaks at approximately the same price level, separated by a minor trough. A Double Bottom is its bullish equivalent, appearing after a downtrend with two distinct troughs at similar levels, separated by a minor peak.
- Identification: The pattern is confirmed when the price breaks below the trough in a Double Top or above the peak in a Double Bottom. Volume often increases on the breakout.
- Trading Strategy: Traders often enter a short position after a Double Top neckline break or a long position after a Double Bottom neckline break. Price targets are commonly calculated by measuring the height of the pattern and projecting it from the breakout point.
Strategies for Volatile Conditions
Trading in volatile markets, such as those that have characterized much of 2026 with rapid shifts in sector leadership and commodity price swings, requires a refined approach. While both continuation and reversal patterns offer valuable insights, their reliability can be tested by sharp, sudden movements.
Confirmation is Key
In choppy markets, false breakouts are more common. Traders often seek additional confirmation signals before acting on a pattern. This might include:
- Volume Analysis: A strong breakout from a pattern should ideally be accompanied by a significant increase in trading volume, indicating conviction behind the move.
- Indicator Confirmation: Using other technical indicators, such as Relative Strength Index (RSI) for momentum or Moving Average Convergence Divergence (MACD) for trend strength, can provide supplementary evidence.
- Re-test of the Breakout Level: Sometimes, after a breakout, the price may retest the former resistance (now support) or support (now resistance) level before continuing in the new direction. This retest can offer a lower-risk entry point.
Risk Management is Paramount
Given the amplified price swings in volatile markets, strict risk management is not just advisable, it’s essential.
- Appropriate Position Sizing: Reducing position size can help mitigate potential losses during unexpected market movements.
- Strategic Stop-Loss Placement: Stop-loss orders are critical for limiting downside. For continuation patterns, stops might be placed just inside the pattern’s boundary. For reversal patterns, they might be placed beyond the “head” or second “top/bottom.” However, volatile markets can trigger stops prematurely, necessitating careful consideration of stop distances.
- Dynamic Trailing Stops: For riding trends, trailing stop-losses can help lock in profits as the market moves favorably, while still protecting against sudden reversals.
Adaptation for 2026 Market Dynamics
The market environment in 2026 continues to present unique challenges and opportunities. With increasing algorithmic trading contributing to rapid price changes and a fragmented global economic outlook, reliance on single indicators or patterns can be insufficient. A multi-faceted approach, incorporating macro-economic awareness alongside technical analysis, is often favored. For instance, a commodity price continuation pattern might be more robust if supported by widely-reported supply chain constraints, while a tech stock reversal might gain credence if accompanied by news of significant regulatory changes or shifts in consumer behavior.
Key Considerations for Gainsium Readers
While both continuation and reversal patterns offer frameworks for market analysis, neither is inherently superior in volatile markets; their utility depends heavily on context, confirmation, and robust risk management. Continuation patterns can be effective for riding established trends that briefly consolidate, provided the underlying market conviction remains strong. Reversal patterns, on the other hand, can offer early signals of a significant trend shift, but often come with higher risk due to the challenge of pinpointing the exact turning point.
For individuals approaching financial markets, it is crucial to understand that these patterns are tools to aid decision-making, not infallible predictors. Developing a personal trading plan that integrates pattern recognition with sound risk management principles and a continuous learning mindset is a common approach. Remember, Gainsium provides general educational content, not personalized financial advice, and individual market conditions and risk tolerance should always guide personal trading decisions.
Disclaimer: This article is provided for general informational and educational purposes only and does not constitute financial, investment, trading, or legal advice. Gainsium is not a registered investment advisor. Markets are volatile and past performance does not guarantee future results. Readers should conduct their own research and consult a licensed financial advisor before making any investment decisions.