
In the fast-evolving financial landscape of 2026, understanding market dynamics requires sophisticated tools and a robust analytical framework. For traders navigating increasingly complex and often volatile markets, technical indicators serve as essential guides, helping to identify trends, gauge momentum, and pinpoint potential entry and exit points. This article explores seven fundamental technical indicators that remain indispensable for traders aiming to enhance their market analysis and decision-making in the current year.
As global markets continue to be shaped by ongoing geopolitical developments, persistent inflation concerns in various sectors, and the ever-accelerating pace of technological innovation, including AI-driven trading algorithms, the ability to interpret market signals effectively is paramount. While no indicator offers a guaranteed crystal ball, mastering these foundational tools can significantly improve a trader’s capacity to react strategically to market shifts.
Understanding the Foundation of Market Analysis
Technical analysis is the study of historical price action and volume data to forecast future price movements. At its core, it operates on the premise that all known information is already reflected in the price of a security. Technical indicators are mathematical calculations based on a security’s price, volume, or open interest, which are then used to predict future price changes.
In 2026, with the prevalence of high-frequency trading and the speed at which information disseminates globally, market participants often experience rapid price fluctuations. This environment makes the judicious application of technical indicators more critical than ever. They help filter market noise, confirm trends, and identify potential reversals, providing a structured approach to decision-making amidst the digital age’s financial currents.
Essential Technical Indicators for 2026
1. Moving Averages (MAs)
Moving Averages are perhaps the most fundamental technical indicators, smoothing out price data over a specified period to create a single flowing line. There are two primary types:
- Simple Moving Average (SMA): Calculates the average price over a period.
- Exponential Moving Average (EMA): Gives more weight to recent prices, making it more responsive to new information.
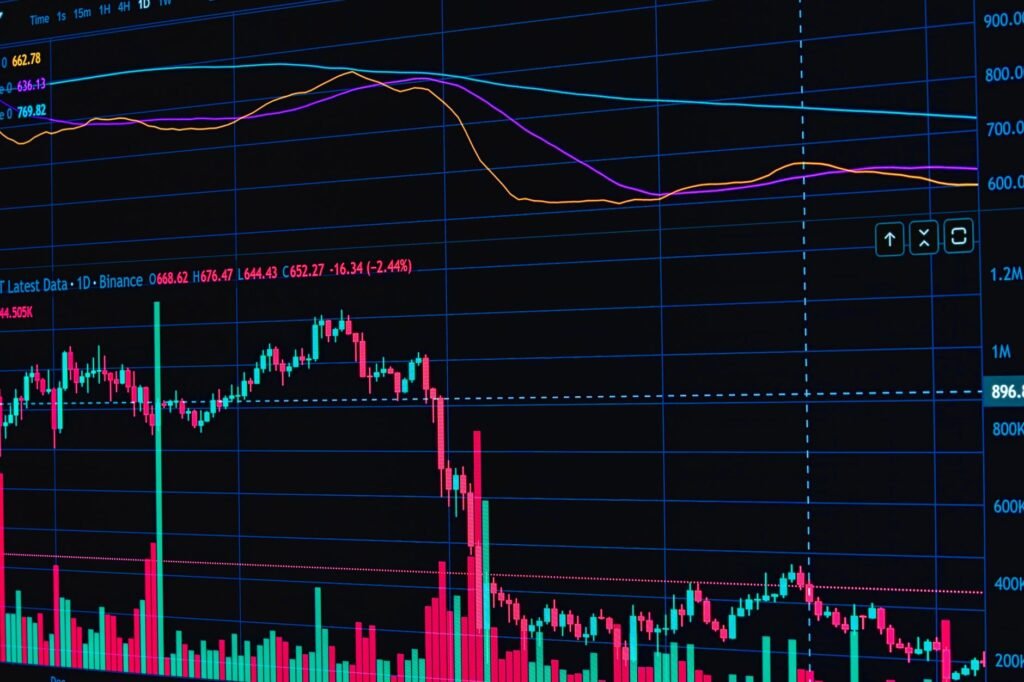
How they are used: Traders utilize MAs to identify trend direction. A rising MA suggests an uptrend, while a falling MA indicates a downtrend. Crossovers of different period MAs (e.g., a 50-day EMA crossing above a 200-day EMA) can signal potential shifts in trend or provide entry/exit points. In 2026, EMAs are particularly valuable due to their responsiveness, which can be crucial in markets prone to sudden shifts.
2. Relative Strength Index (RSI)
The Relative Strength Index is a momentum oscillator that measures the speed and change of price movements. It oscillates between zero and 100.
How it is used: The RSI helps identify overbought or oversold conditions. Readings above 70 typically suggest a security is overbought and may be due for a pullback, while readings below 30 suggest it is oversold and potentially undervalued. Divergences between price and RSI can also signal potential reversals, making it a key tool for traders in identifying exhaustion in current trends.
3. Moving Average Convergence Divergence (MACD)
The MACD is a trend-following momentum indicator that shows the relationship between two moving averages of a security’s price. It consists of the MACD line, the signal line, and a histogram.
How it is used: The MACD generates trading signals when the MACD line crosses above or below the signal line. Crossovers above zero indicate bullish momentum, while crossovers below zero suggest bearish momentum. The histogram visualizes the difference between the MACD line and its signal line, indicating strengthening or weakening momentum. It is particularly useful in 2026 for confirming trends and identifying early shifts in momentum that might be masked by short-term volatility.
4. Bollinger Bands (BB)
Bollinger Bands are a volatility indicator consisting of a simple moving average (the middle band) and two outer bands, which are typically two standard deviations away from the SMA. They adjust to market volatility, widening during periods of high volatility and narrowing during low volatility.
How they are used: Traders use Bollinger Bands to identify periods of high and low volatility, potential price targets, and overbought/oversold conditions at the bands themselves. Prices touching or breaking through the outer bands can signal potential reversals or continuation. The
Disclaimer: This article is provided for general informational and educational purposes only and does not constitute financial, investment, trading, or legal advice. Gainsium is not a registered investment advisor. Markets are volatile and past performance does not guarantee future results. Readers should conduct their own research and consult a licensed financial advisor before making any investment decisions.