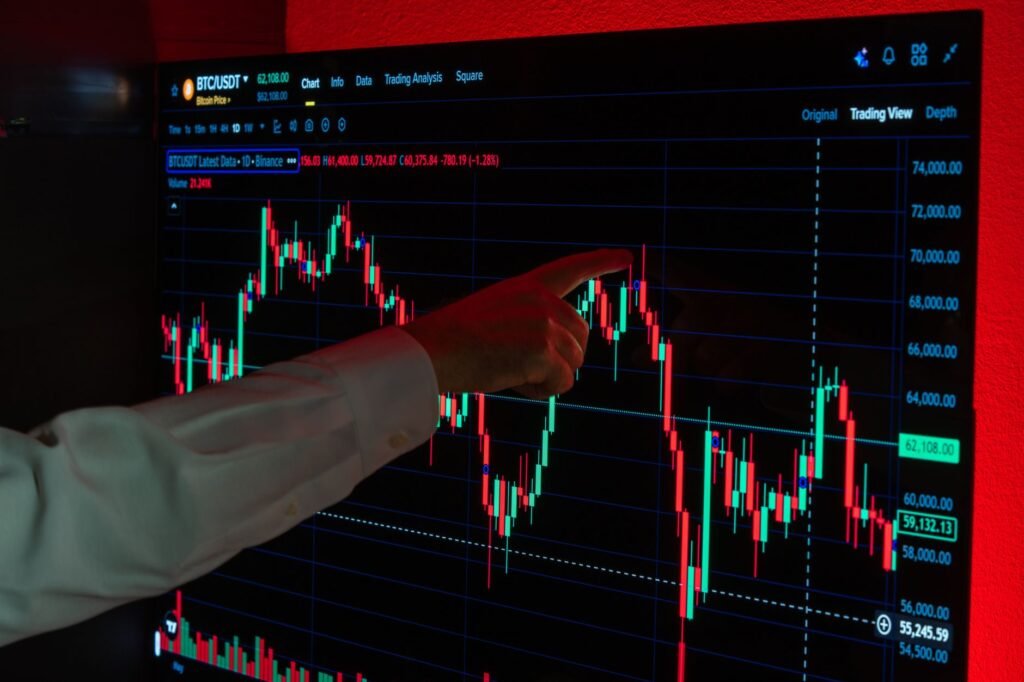

In the fast-paced world of financial markets, understanding the underlying mechanics of supply and demand is crucial for making informed trading decisions. Market depth, often referred to as Level 2 data, provides a granular view into the real-time order book for a particular security, revealing not just the best available bid and ask prices, but also the volume of orders at various price levels. For traders, interpreting this data offers insights into potential price movements, market sentiment, and liquidity, enabling a more strategic approach to entries and exits.
Understanding Market Depth: The Order Book Revealed
At its core, market depth illustrates the collective intentions of buyers and sellers for a specific asset at any given moment. Unlike basic Level 1 data, which typically shows only the highest bid and lowest ask price (the ‘best’ prices), market depth data expands upon this by displaying multiple bid and ask prices, along with the corresponding quantities of shares or contracts offered at each price point. This comprehensive view is essentially a digital snapshot of the order book.
What is Market Depth?
Market depth presents a tiered view of pending buy and sell orders. On one side, the bid side lists the prices at which market participants are willing to buy a security, ordered from highest to lowest, along with the total quantity of shares requested at each price. On the other, the ask side (or offer side) displays the prices at which sellers are willing to unload the security, ordered from lowest to highest, also showing the corresponding quantities. The difference between the highest bid and lowest ask is known as the spread, which reflects market liquidity and efficiency.
Components of Market Depth Data
- Bid Prices and Sizes: These are the prices buyers are currently offering for the asset. A higher quantity at a particular bid price can indicate strong buying interest or a significant support level.
- Ask Prices and Sizes: These represent the prices sellers are demanding for the asset. A large quantity at an ask price might suggest strong selling pressure or a resistance level.
- Market Makers and Liquidity Providers: These entities play a vital role in populating the order book, continually placing both bid and ask orders to facilitate trading and maintain liquidity. Their presence ensures there is always a buyer and a seller, though the efficiency varies by asset and market conditions.
How Traders Leverage Market Depth Information
Skilled traders do not merely glance at market depth; they actively analyze it to discern subtle shifts in market dynamics that might not be apparent from price charts alone. This detailed view of supply and demand can be a powerful complement to other forms of technical and fundamental analysis.
Identifying Supply and Demand Imbalances
One of the primary uses of market depth is to identify significant concentrations of buy or sell orders. A large volume of shares stacked at a specific bid price, often referred to as a ‘buy wall,’ can suggest a strong support level where significant buying interest could halt a price decline. Conversely, a ‘sell wall’ – a large quantity of shares at an ask price – might indicate a formidable resistance level. Traders also watch for ‘iceberg orders,’ which are large orders deliberately broken into smaller visible parts, with the true size only revealing itself as smaller pieces are filled. Spotting these can provide early warnings of substantial institutional interest.
Gauging Market Sentiment and Liquidity
The overall ‘thickness’ of the order book offers insights into an asset’s liquidity and prevailing market sentiment. A thick order book, characterized by many bids and asks across various price levels with substantial quantities, generally indicates high liquidity. This suggests that large orders can be filled without significantly impacting the price, which is often desirable for institutional traders. Conversely, a thin order book, with sparse orders and wide spreads, points to low liquidity, where even moderate trades could cause significant price volatility. In 2026, with the continued dominance of algorithmic trading and high-frequency trading (HFT), order books can change with extreme rapidity. Algorithms are constantly refreshing, cancelling, and placing orders, which means human traders must interpret these dynamic shifts efficiently to avoid being misled by fleeting displays of depth.
Improving Entry and Exit Strategies
Market depth data can refine trading strategies in several ways:
- Confirming Breakouts/Breakdowns: Before entering a trade on a perceived price breakout, a trader might examine the order book. If a strong ‘sell wall’ above a resistance level suddenly diminishes as price approaches, it could signal genuine buying strength ready to push through.
- Strategic Limit Order Placement: Instead of blindly placing limit orders, traders can use market depth to position their orders just below a significant buy wall (for buying) or just above a strong sell wall (for selling), aiming to get filled without moving the market against them.
- Avoiding Slippage: In less liquid assets, placing a market order without checking depth can result in substantial slippage, where the execution price is significantly worse than the quoted price. Market depth helps traders assess if enough liquidity exists at their desired price points to execute a trade efficiently.
Limitations and Considerations for Using Market Depth
While invaluable, market depth is not without its challenges and limitations. It’s a snapshot, not a crystal ball, and its dynamic nature requires constant vigilance.
Dynamic Nature of the Order Book
The information displayed in the order book is constantly changing. Orders can be modified, cancelled, or filled in milliseconds, especially in today’s highly computerized markets. What appears as a strong buy wall one moment might disappear the next, either because the orders were filled or, more often, cancelled by algorithmic systems reacting to market conditions. This rapid flux means that visual interpretations of static order book screens can be deceptive.
Impact of Algorithmic Trading and Market Manipulation
The proliferation of sophisticated algorithms and high-frequency trading firms since the early 2000s has fundamentally altered how market depth is presented and perceived. A significant portion of visible orders in the book may be placed by algorithms designed to probe liquidity, test levels, or even create ‘phantom’ walls that are pulled before they can be executed against. Practices like ‘spoofing’ and ‘layering’ – placing large orders with no intention of executing them, merely to create a false impression of supply or demand – have historically presented challenges and remain areas of regulatory scrutiny in 2026. Therefore, while the depth shows potential liquidity, it does not always represent genuine trading interest.
Not a Standalone Indicator
Relying solely on market depth for trading decisions is generally not advisable. It provides context about immediate supply and demand but offers little insight into broader market trends, fundamental value, or macroeconomic factors that drive longer-term price movements. Prudent traders integrate market depth analysis with other tools, such as candlestick patterns, volume profiles, moving averages, and an understanding of the overall economic landscape. For instance, in 2026, geopolitical events, interest rate expectations, and technological advancements continue to be major catalysts influencing asset prices, making a holistic view essential.
Ultimately, market depth serves as a potent tool for traders seeking an edge in understanding short-term market dynamics. By offering a detailed glimpse into the order book, it allows for more nuanced interpretations of supply and demand, informing more precise entry and exit points. However, its effectiveness is maximized when used in conjunction with a broader analytical framework, acknowledging its dynamic nature and the prevalence of advanced trading technologies that shape its appearance.
Disclaimer: This article is provided for general informational and educational purposes only and does not constitute financial, investment, trading, or legal advice. Gainsium is not a registered investment advisor. Markets are volatile and past performance does not guarantee future results. Readers should conduct their own research and consult a licensed financial advisor before making any investment decisions.