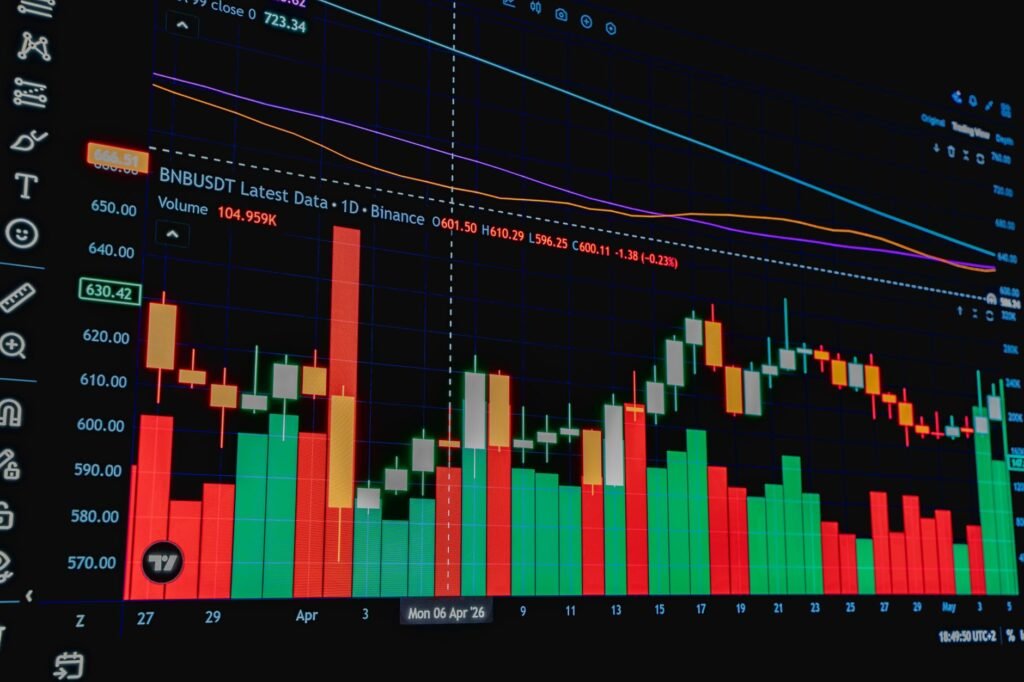

The financial markets of 2026 demand sophisticated analytical tools for traders seeking an edge. Among these, Volume Profile stands out as a powerful, often underutilized technique for understanding market structure and participant behavior. This guide will explore how to effectively integrate Volume Profile into trading strategies, helping to identify crucial price levels, gauge market interest, and refine decision-making in the current dynamic environment.
What is Volume Profile?
Unlike traditional volume indicators that display total volume over a period at the bottom of a chart, Volume Profile displays the total volume traded at specific price levels over a chosen period. This horizontal representation offers a unique perspective, revealing where the majority of trading activity has occurred, indicating areas of high market interest or agreement.
Beyond Standard Volume Bars
Conventional volume bars sum up activity vertically for each time candle. Volume Profile, conversely, dissects that activity by price. Imagine a histogram turned on its side, aligned with the price axis; that is essentially a Volume Profile. It provides a deeper understanding of market participants’ consensus on value, showing concentrations of trading at particular price points.
Why Volume Profile Matters in Modern Markets
In 2026, with the increasing prevalence of algorithmic trading and high-frequency trading (HFT), market structure can evolve rapidly. Volume Profile remains relevant by illustrating areas where significant capital has been committed. These zones often act as magnets for future price action or as strong levels of support and resistance. Understanding where liquidity has accumulated or evaporated is crucial for navigating markets influenced by both human and automated decisions.
Key Components of Volume Profile
To effectively use Volume Profile, understanding its core components is essential.
Value Area (VA)
The Value Area represents the price range where a significant percentage of the total volume for a given period was traded. Typically, this is set to 70% of the total volume. The Value Area highlights where the market considers fair value, and price often spends a substantial amount of time oscillating within this range. Breakouts from or rejections of the Value Area can signal shifts in market sentiment.
Point of Control (POC)
The Point of Control (POC) is the single price level within the profile where the highest volume was traded. It signifies the price at which the most transactions occurred, suggesting a consensus of fair value or maximum liquidity. The POC frequently acts as a strong gravitational pull for price, often being revisited and tested.
High Volume Nodes (HVNs) and Low Volume Nodes (LVNs)
- High Volume Nodes (HVNs): These are areas within the profile, other than the POC, where significantly high volume occurred. HVNs indicate price levels where the market found temporary agreement or consolidation. They can act as strong support or resistance zones.
- Low Volume Nodes (LVNs): These are areas where very little volume was traded. LVNs often represent price levels where the market moved quickly through, indicating inefficiency or imbalance. Price tends to “slice through” LVNs relatively easily, and they can act as weaker support/resistance or areas where price acceleration might occur.
Applying Volume Profile in 2026 Trading Strategies
Volume Profile offers actionable insights that can be integrated into various trading styles, from day trading to swing trading.
Identifying Support and Resistance
HVNs and the POC are natural candidates for identifying robust support and resistance levels. When price approaches an HVN from above, it might find support as buyers step in, recognizing it as a previously accepted value area. Conversely, an HVN approached from below could act as resistance. LVNs, due to their lack of traded volume, often represent weaker levels that price might pass through with less friction.
Confirming Trend Strength
During an uptrend, if price consolidates around new, higher HVNs, it suggests that buyers are accepting higher prices as fair value, confirming trend strength. In a downtrend, if price establishes new, lower HVNs, it indicates sellers are dominating. A lack of volume at significant price moves can signal a potential fakeout or an exhaustion of the trend.
Entry and Exit Points
Traders often use the Value Area as a benchmark. If price opens outside the previous day’s or session’s Value Area and then attempts to re-enter, it might indicate a rejection of the new price level and a return to the old value. Conversely, a strong break and acceptance above or below the Value Area can signal a continuation of a new trend. The POC can serve as a target for price reversion or as a retest level after a breakout.
Scalping and Day Trading with Volume Profile
For shorter-term strategies, Volume Profile can be invaluable. Day traders often look for price interactions with the POC or Value Area boundaries from shorter timeframes (e.g., hourly or session profiles). A common approach involves identifying reversals from LVNs or breakouts from HVNs. For instance, a price returning to a prior POC on an intraday chart after a strong move can offer a low-risk entry point if confirmation signals (like candlestick patterns or order flow) align.
Advanced Volume Profile Techniques
Beyond the basics, several advanced applications can further enhance Volume Profile analysis.
Market Profile Integration
While often used interchangeably, Market Profile (introduced by J. Peter Steidlmayer) focuses on time at price, depicting the distribution of time at various price levels, whereas Volume Profile focuses purely on volume at price. Combining the two can provide a holistic view: understanding where the most volume was traded (Volume Profile) and how long the market spent there (Market Profile) offers a richer context for market dynamics. This integrated approach can be particularly insightful for discerning accumulation and distribution phases.
Volume Profile and Order Flow
In 2026, the synergy between Volume Profile and order flow analysis is increasingly powerful. Volume Profile provides the macro structure, indicating areas of past liquidity and interest. Order flow tools (such as cumulative delta or heatmap visualizations) provide granular, real-time insight into buyer and seller aggression at those key Volume Profile levels. For example, if price reaches an HVN and order flow indicates aggressive selling, it reinforces the HVN as resistance.
Multi-Timeframe Analysis
Examining Volume Profile across multiple timeframes (e.g., weekly, daily, and intraday) offers a layered perspective. A significant HVN on a weekly chart carries more weight than an intraday HVN. Traders can use longer-term profiles to identify major structural levels and then zoom into shorter-term profiles to pinpoint precise entry and exit points or confirm reactions at those larger levels. This hierarchical approach helps distinguish between noise and significant market events.
Considerations and Limitations
While powerful, Volume Profile is not a magic bullet and comes with its own set of considerations.
Not a Standalone Indicator
Volume Profile is best utilized as a component of a comprehensive trading strategy, not in isolation. Combining it with other forms of technical analysis, such as trendlines, moving averages, candlestick patterns, or fundamental analysis, can provide stronger confirmation and reduce false signals. For instance, a strong Volume Profile resistance level becomes more potent if it aligns with a downward-sloping trendline.
Data and Platform Dependencies
The accuracy and usefulness of Volume Profile depend heavily on reliable data feeds and robust charting platforms. Access to real-time, tick-by-tick data is crucial for generating accurate profiles. Traders should ensure their chosen platform provides comprehensive Volume Profile tools and historical data necessary for effective analysis. The availability of diverse datasets across different asset classes continues to expand in 2026, offering more opportunities for nuanced analysis.
Evolving Market Dynamics
The financial markets in 2026 are characterized by rapid technological advancements and shifting macroeconomic landscapes. While Volume Profile provides historical context of market activity, traders must remain adaptable. New market participants, regulatory changes, and global events can all influence how liquidity forms and where value is perceived. Continuously updating one’s understanding of market structure and remaining flexible in strategy application is paramount.
In conclusion, Volume Profile remains an indispensable tool for traders aiming to deepen their market understanding in 2026. By dissecting volume at specific price levels, it reveals the true consensus of market participants, helping to identify strong support/resistance, confirm trends, and optimize entry/exit points. When combined with other analytical methods and a keen awareness of current market dynamics, Volume Profile empowers traders to make more informed and strategic decisions, moving beyond simple price action to grasp the underlying forces of supply and demand.
Disclaimer: This article is provided for general informational and educational purposes only and does not constitute financial, investment, trading, or legal advice. Gainsium is not a registered investment advisor. Markets are volatile and past performance does not guarantee future results. Readers should conduct their own research and consult a licensed financial advisor before making any investment decisions.