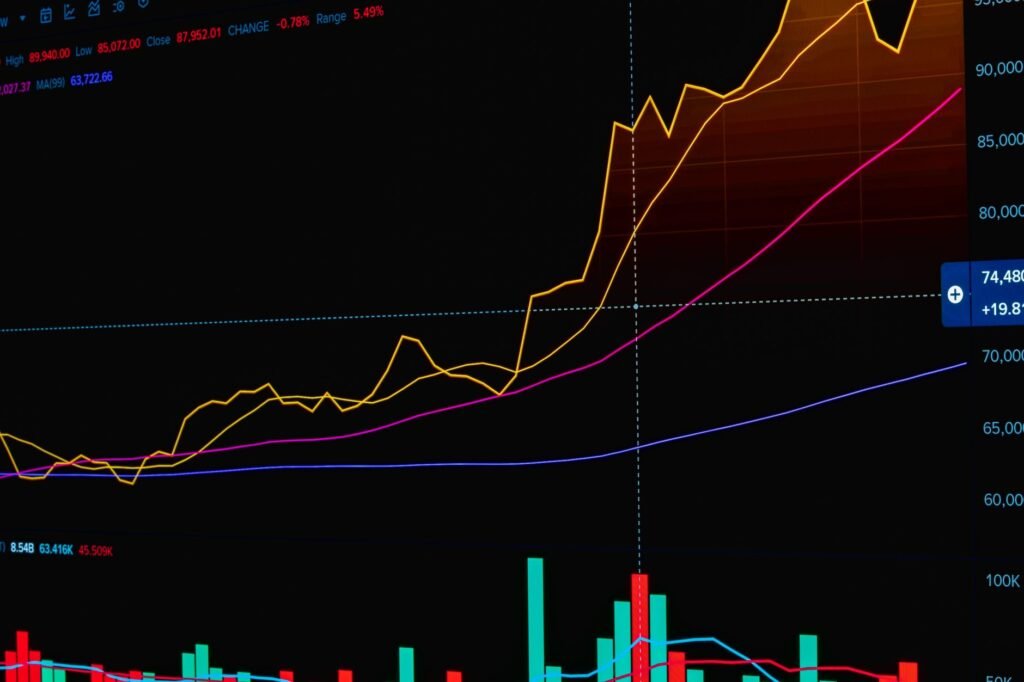

Understanding how to use supply and demand zones is a cornerstone for traders aiming to refine their entry and exit points in the dynamic financial markets. These zones represent critical price areas where an imbalance between buying and selling pressure has historically led to significant price reversals or continuations. By identifying and interpreting these zones on a price chart, traders can gain a clearer perspective on potential turning points and improve the accuracy of their trade management strategies.
Understanding Supply and Demand Zones
At its core, financial market movement is driven by the perpetual battle between supply (sellers) and demand (buyers). When demand exceeds supply at a particular price level, prices tend to rise. Conversely, when supply overwhelms demand, prices typically fall. Supply and demand zones are not merely single price levels but rather areas on a chart where this imbalance has previously manifested with significant force, leaving an imprint.
Unlike traditional support and resistance lines, which are often drawn as single horizontal lines, supply and demand zones encompass a wider price range. This range accounts for the varying exact entry and exit points of institutional players and ensures a more robust area of interest. These zones are formed when price rallies or drops sharply away from a consolidation area, indicating that a substantial order block was filled, creating a vacuum that price later moves back to test.
The Anatomy of Zone Formation
- Demand Zone (Drop-Base-Rally or Rally-Base-Rally): Formed when price drops into a consolidation (the base) and then rallies strongly away, or when price rallies into a base and then rallies even stronger. This indicates a strong presence of buyers at that base.
- Supply Zone (Rally-Base-Drop or Drop-Base-Drop): Formed when price rallies into a consolidation (the base) and then drops sharply away, or when price drops into a base and then drops even sharper. This signals a strong presence of sellers at that base.
The strength of a zone is often judged by the speed and conviction with which price left the zone. A powerful, impulsive move away from the base suggests a greater imbalance and, therefore, a potentially stronger zone.
Identifying Supply Zones on Price Charts
Identifying supply zones involves looking for areas where sellers took control, causing a significant price decline. A common pattern is the Rally-Base-Drop (RBD). Price rallies, consolidates briefly (the base), and then drops sharply. The base represents the supply zone.
To draw a supply zone, traders typically identify the last up-candle or series of small candles before the sharp price drop. The zone is often drawn from the highest point of the base (the wick of the highest candle) down to the lowest body of the candles within that base. Some methodologies use the open and close of the candles to define the zone. The key is to capture the area where selling pressure became dominant.
When price returns to a previously established supply zone, it often encounters renewed selling interest, potentially leading to a reversal or at least a significant pause in the uptrend. A fresh supply zone, one that price has not yet retested, is generally considered stronger.
Identifying Demand Zones on Price Charts
Conversely, identifying demand zones involves pinpointing areas where buyers asserted dominance, leading to a substantial price increase. A common pattern here is the Drop-Base-Rally (DBR). Price drops, consolidates briefly (the base), and then rallies sharply. This base is your demand zone.
To draw a demand zone, traders identify the last down-candle or series of small candles before the strong price rally. The zone is typically drawn from the lowest point of the base (the wick of the lowest candle) up to the highest body of the candles within that base. As with supply zones, the exact drawing method can vary slightly, but the objective is to encapsulate the area of strong buying accumulation.
When price re-enters a well-defined demand zone, it often finds renewed buying interest, potentially leading to an upward reversal. Similar to supply zones, fresh demand zones that have not been tested previously often offer a more reliable reaction.
Utilizing Zones for Precise Entry and Exit
The true power of supply and demand zones lies in their application to trade execution, offering a disciplined approach to entry and exit points.
Entry Strategies
- Waiting for Price to Return: The most common strategy is to wait for price to return to a previously identified, strong supply or demand zone. For a demand zone, traders might look for long entry opportunities as price enters the zone. For a supply zone, short entry opportunities are considered as price approaches the zone’s upper boundary.
- Confirmation: While some traders enter directly upon price touching the zone, a more conservative approach involves waiting for confirmation. This could be a specific candlestick pattern (e.g., a bullish engulfing at a demand zone, a bearish engulfing at a supply zone) or a break of a smaller timeframe trend line within the zone.
- Multiple Timeframe Analysis: Identifying robust zones on higher timeframes (e.g., daily or 4-hour charts) provides a broader structural context. Traders can then zoom into lower timeframes (e.g., 1-hour or 15-minute charts) to refine their entry and look for precise confirmation signals within that higher-timeframe zone.
Exit Strategies (Stop Loss and Take Profit)
- Stop Loss Placement: One significant advantage of trading with zones is the clear definition they provide for stop loss placement. For a long trade initiated from a demand zone, a stop loss is typically placed just below the zone’s lower boundary. For a short trade from a supply zone, the stop loss is placed just above the zone’s upper boundary. This placement ensures that if the zone fails to hold, the trade is exited with a predefined, manageable loss.
- Take Profit Targets: Profit targets are often set at the next opposing supply or demand zone. For instance, a long trade from a demand zone might target the nearest supply zone as a take-profit area. This approach helps maintain favorable risk-reward ratios, a crucial aspect of sustainable trading. Alternatively, traders might scale out of positions as price approaches these targets or use fixed risk-reward ratios.
Practical Considerations and 2026 Market Context
In an era characterized by evolving macroeconomic conditions, technological advancements, and heightened market interconnectedness, the principles of supply and demand remain fundamentally relevant. As markets in 2026 continue to experience various influences, from shifting global interest rate expectations to the ongoing impact of AI in financial analysis, understanding these core mechanics is crucial.
- Volatility and Market Structure: With potential for increased market volatility driven by geopolitical factors and economic data, the clear structural reference points provided by supply and demand zones can be invaluable. They help traders cut through market noise and focus on areas where significant directional shifts have historically occurred.
- Algorithmic Trading Impact: The prevalence of algorithmic trading, a significant feature of modern markets including those in 2026, often means price reactions at these critical zones can be amplified. Many sophisticated algorithms are programmed to react to such technical levels, potentially reinforcing the zone’s effectiveness when price revisits it.
- Risk Management is Paramount: While supply and demand zones are powerful tools, they are not infallible. Zones can be broken, and markets can behave unpredictably. Therefore, robust risk management is essential. This includes proper position sizing, never risking more than a small percentage of capital on a single trade, and understanding that even the strongest zones can fail.
- Zone Freshness and Time: Generally, a fresh zone (one that has not been tested before) is considered stronger than a zone that has been revisited multiple times. Each test can deplete the number of pending orders within that zone, making subsequent tests less reliable.
- Confirmation is Key: For newer traders, waiting for clear price action confirmation within a zone before entering a trade can significantly reduce risk and increase conviction. This cautious approach can prevent premature entries into zones that may not hold.
By integrating supply and demand zone analysis into a comprehensive trading plan, market participants can enhance their ability to identify high-probability entry and exit points, manage risk more effectively, and navigate the complexities of financial markets with greater confidence.
Disclaimer: This article is provided for general informational and educational purposes only and does not constitute financial, investment, trading, or legal advice. Gainsium is not a registered investment advisor. Markets are volatile and past performance does not guarantee future results. Readers should conduct their own research and consult a licensed financial advisor before making any investment decisions.