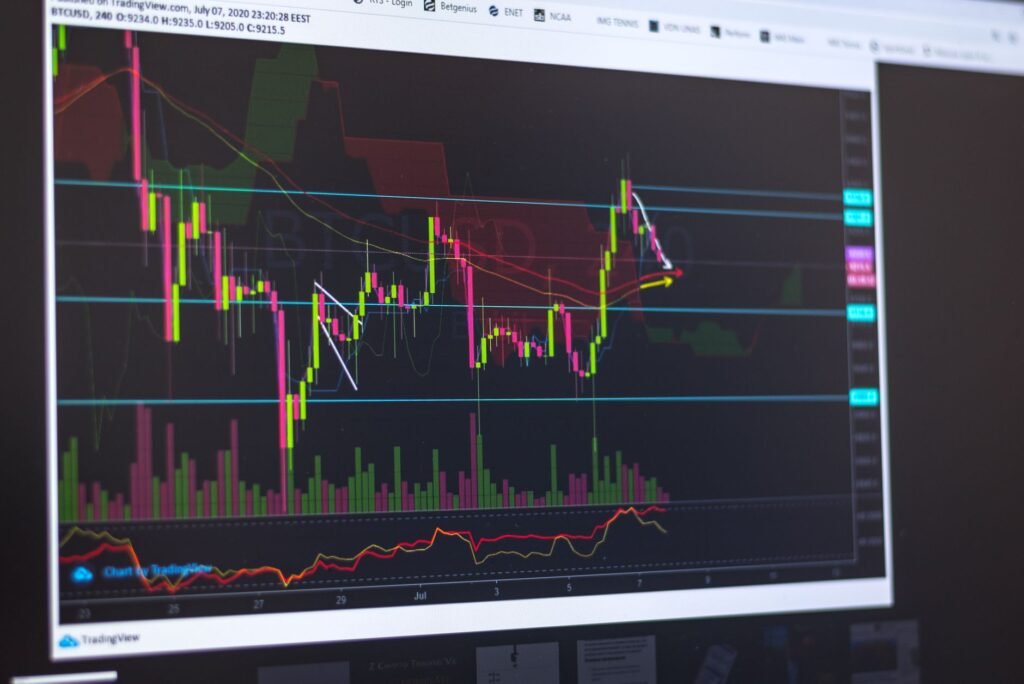

Fibonacci retracements are a popular technical analysis tool used by traders to identify potential areas of support and resistance in financial markets. This beginner’s guide will walk you through how to understand and apply these levels effectively, providing a foundational understanding for their use in various trading strategies. In a dynamic market environment, where volatility can be a consistent factor, as observed in recent years leading into 2026, tools that help identify potential turning points can be particularly valuable for some market participants.
What are Fibonacci Retracements?
At their core, Fibonacci retracements are based on the Fibonacci sequence, a series of numbers discovered by Leonardo Pisano, an Italian mathematician. Each number in the sequence is the sum of the two preceding ones (0, 1, 1, 2, 3, 5, 8, 13, 21, 34, and so on). The significance for financial markets arises from the mathematical relationships, or ratios, derived from this sequence.
The Fibonacci Sequence
While the sequence itself is a fascinating mathematical concept, its application in trading comes from the specific ratios obtained when dividing numbers within the sequence. For example, dividing one number by the number that follows it (e.g., 21/34) yields approximately 0.618. Dividing a number by the second number to its right (e.g., 21/55) yields approximately 0.382. These ratios, along with others, form the basis of the retracement levels.
Key Retracement Levels
In technical analysis, the most commonly observed Fibonacci retracement levels are:
- 23.6%
- 38.2%
- 50% (though not a true Fibonacci ratio, it’s widely used due to its psychological significance as a midpoint)
- 61.8% (often considered the golden ratio)
- 78.6% (the square root of 61.8% is approximately 78.6%)
These percentages represent potential areas where a price might reverse after a significant move. The idea is that after a strong trend (up or down), the price often retraces a portion of that move before continuing in the original direction.
Why Use Fibonacci Retracements in Trading?
Fibonacci retracements are utilized by many traders as a predictive tool, not in terms of guaranteeing future prices, but in identifying areas where market psychology might lead to significant price action. Their appeal lies in their universality; these ratios are observed in nature, art, and architecture, and many believe they also influence human behavior in financial markets.
Identifying Support and Resistance
The primary use of Fibonacci retracements is to pinpoint potential levels of support and resistance. In an uptrend, after a period of price appreciation, a pullback (or retracement) might find support at one of the Fibonacci levels. Conversely, in a downtrend, after a price drop, a bounce might encounter resistance at these same levels. Recognizing these zones can help traders anticipate where buying or selling pressure might increase.
Confirmation with Other Tools
While Fibonacci retracements can be powerful, they are often most effective when used in conjunction with other technical analysis tools. For example, a Fibonacci retracement level that coincides with a significant moving average, a previous high/low, or a trendline might offer a stronger signal. Some analysts also combine them with volume indicators or candlestick patterns to seek further confirmation of potential reversals. In the diversified and often fast-moving markets of 2026, a multi-faceted approach to technical analysis is frequently favored by experienced traders.
How to Apply Fibonacci Retracements
Applying Fibonacci retracement levels to a price chart is a straightforward process once the core principles are understood. Most modern charting platforms include a dedicated Fibonacci retracement tool.
Drawing the Tool
- Identify a significant price move: Look for a clear swing high and swing low. For an uptrend, this means identifying the lowest point of the move (swing low) and the highest point (swing high). For a downtrend, identify the highest point (swing high) and the lowest point (swing low).
- Draw the retracement tool: If the price has been rising, draw the Fibonacci retracement tool from the swing low to the swing high. The tool will then project the retracement levels downwards. If the price has been falling, draw the tool from the swing high to the swing low, and it will project the retracement levels upwards.
- Observe the levels: The charting software will automatically display horizontal lines at the 23.6%, 38.2%, 50%, 61.8%, and 78.6% levels between your chosen swing points.
Interpreting the Levels
Once drawn, the Fibonacci lines act as potential points of interest. A price that pulls back to the 38.2% level and then reverses may indicate a relatively strong trend. A deeper retracement to the 50% or 61.8% level suggests a weaker trend but still a potential continuation. The 61.8% level is often considered a critical line, as a break below (in an uptrend) or above (in a downtrend) this level might suggest a potential trend reversal rather than a mere retracement.
Practical Application
For example, in an established uptrend, if an asset pulls back, traders might watch for the price to find support near the 38.2% or 61.8% retracement levels. A bounce from one of these levels, especially if accompanied by increased volume or bullish candlestick patterns, could be interpreted as a potential opportunity for the trend to resume. Conversely, a sustained break through these levels might signal a deeper correction or a trend reversal, prompting some market participants to adjust their positions. The applicability extends across various asset classes, from traditional equities and commodities to foreign exchange and digital assets, reflecting their broad utility in current markets.
Limitations and Considerations
While Fibonacci retracements are a widely used tool, it is important to acknowledge their limitations. They are not foolproof predictors, and prices do not always respect these levels. Here are some key considerations:
- Subjectivity: Determining the correct swing high and swing low can sometimes be subjective, leading to different interpretations among traders.
- Not a guarantee: Fibonacci levels are potential areas of support or resistance, not definitive turning points. Prices can easily move through these levels.
- Market context matters: The effectiveness of Fibonacci retracements can be influenced by broader market conditions, news events, and fundamental factors. For instance, significant macroeconomic shifts or unexpected corporate news can override technical patterns.
- Confirmation is key: As mentioned, combining Fibonacci retracements with other indicators and analysis methods can help validate potential signals and reduce reliance on a single tool. Relying solely on Fibonacci levels for trading decisions can be risky.
Ultimately, while Fibonacci retracements offer a structured way to identify potential support and resistance, they are best viewed as one component of a comprehensive technical analysis strategy. Developing proficiency with this tool, like any other, requires practice and a thorough understanding of market dynamics.
Disclaimer: This article is provided for general informational and educational purposes only and does not constitute financial, investment, trading, or legal advice. Gainsium is not a registered investment advisor. Markets are volatile and past performance does not guarantee future results. Readers should conduct their own research and consult a licensed financial advisor before making any investment decisions.