
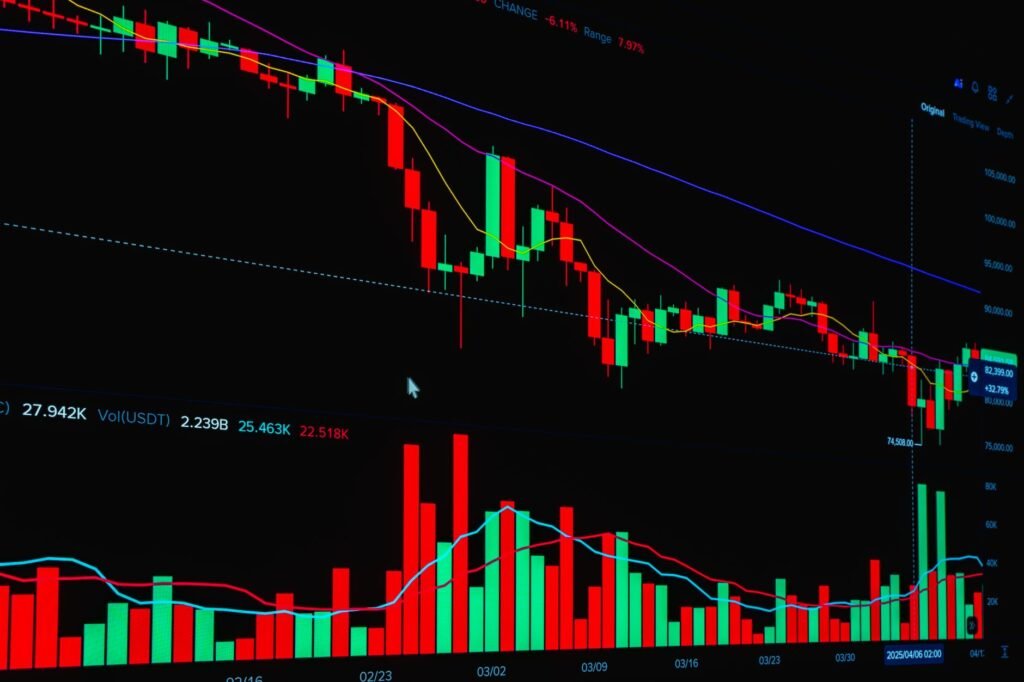

Introduction
For traders seeking to identify potential turning points and key price levels, Fibonacci retracements offer a widely utilized technical analysis tool. This article will explain what Fibonacci retracement levels are, how to draw them on a price chart, and how traders can use them to identify potential support, resistance, and price targets. In the dynamic market environment of 2026, where algorithmic trading often amplifies price movements and volatility remains a consistent theme, understanding tools like Fibonacci retracements can be crucial for discerning potential areas of interest.
Understanding Fibonacci Retracements
What Are Fibonacci Numbers?
At the heart of Fibonacci retracements lies the Fibonacci sequence, a series of numbers discovered by Leonardo Pisano, an Italian mathematician. This sequence begins with 0 and 1, and each subsequent number is the sum of the two preceding ones (e.g., 0, 1, 1, 2, 3, 5, 8, 13, 21, 34, and so on). What makes these numbers significant in financial markets, as well as in nature and art, is the relationships that emerge when one number is divided by its successor or predecessor.
When any number in the sequence is divided by the number immediately following it, the ratio approaches approximately 0.618 (e.g., 34/55 ≈ 0.618). When divided by the number two places to its right, the ratio approaches approximately 0.382 (e.g., 34/89 ≈ 0.382). These ratios, particularly 0.618 (often referred to as the Golden Ratio) and 0.382, form the basis of the key Fibonacci retracement levels.
Key Retracement Levels
The most commonly observed Fibonacci retracement levels are 23.6%, 38.2%, 50%, 61.8%, and 78.6%. While 50% is not a pure Fibonacci ratio, it is widely included due to its psychological significance in markets, representing a halfway point in a price move. These percentages represent how much of a prior price move a market might retrace before potentially continuing in its original direction.
Beyond retracement, Fibonacci also offers extension levels, which can be used to project potential price targets once a trend resumes. Common extension levels include 123.6%, 138.2%, and 161.8%.
Drawing Fibonacci Retracements on a Chart
The efficacy of Fibonacci retracements largely depends on accurately identifying significant price swings. The process is straightforward in most modern charting platforms.
Identifying the Swing High and Swing Low
To draw Fibonacci retracement levels, traders must first identify a distinct price movement, defined by a
Disclaimer: This article is provided for general informational and educational purposes only and does not constitute financial, investment, trading, or legal advice. Gainsium is not a registered investment advisor. Markets are volatile and past performance does not guarantee future results. Readers should conduct their own research and consult a licensed financial advisor before making any investment decisions.