
Understanding how to interpret supply chain indicators is more critical than ever for market forecasting in 2026. These metrics offer valuable insights into the health of the global economy, potential inflationary pressures, and the future performance of various market sectors. In an interconnected world where goods move constantly, the efficiency and bottlenecks within supply chains can serve as powerful leading indicators for investors and market watchers alike.
The global economy in 2026 continues to navigate the complexities stemming from recent geopolitical shifts, technological advancements, and evolving consumer behaviors. Consequently, a keen eye on the flow of goods and services through supply networks can provide a significant analytical edge in anticipating market trends.
The Evolving Landscape of Supply Chains in 2026
The supply chain environment in 2026 is a product of significant transformation. Following the widespread disruptions witnessed in the early 2020s, businesses have increasingly prioritized resilience, diversification, and visibility. The era of just-in-time inventory has, in many cases, given way to a more balanced approach that considers both efficiency and the ability to withstand shocks. Geopolitical tensions persist in various regions, influencing trade routes and manufacturing locations, pushing companies towards strategies like “friend-shoring” or regionalized production.
Furthermore, the integration of advanced technologies like Artificial Intelligence (AI), machine learning, and Internet of Things (IoT) devices has become more prevalent, promising greater transparency and predictive capabilities within supply networks. However, the adoption is uneven, creating a complex patchwork of highly optimized and still vulnerable links.
Key Supply Chain Indicators and Their Interpretation
Monitoring a diverse set of indicators provides a comprehensive view of supply chain health and its potential impact on markets.
Freight and Logistics Data
- Baltic Dry Index (BDI): This index measures the cost of shipping raw materials by sea. A rising BDI can signal increased demand for raw goods, often preceding heightened industrial activity and potentially economic growth. Conversely, a falling BDI might suggest slowing global trade.
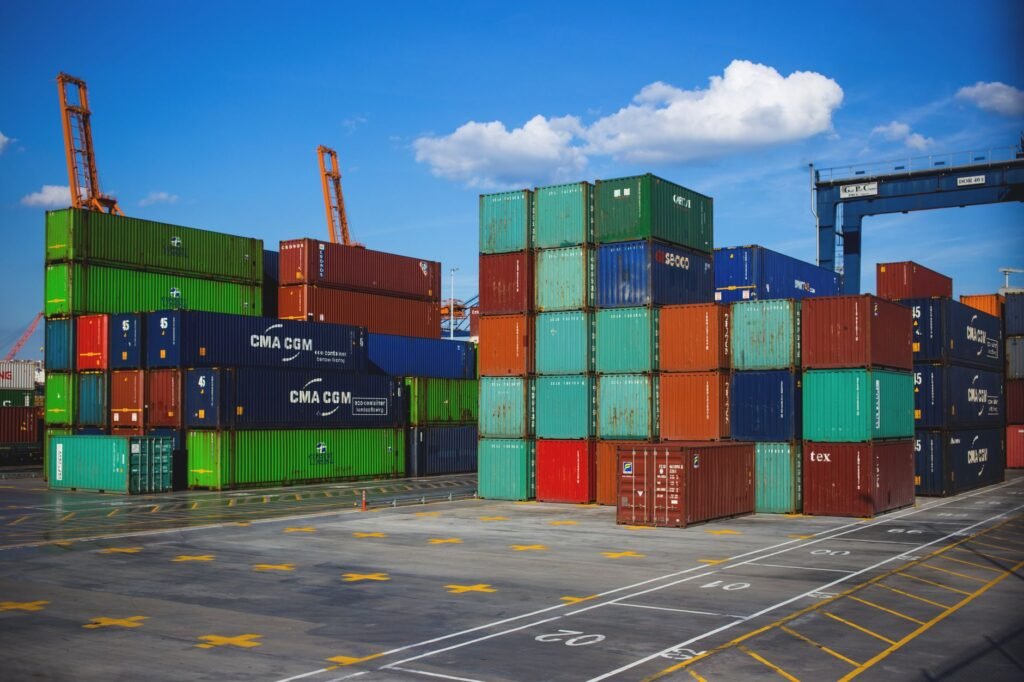
- Shipping Costs and Port Congestion: Elevated container shipping rates and prolonged port congestion indicate bottlenecks, which can lead to higher input costs for businesses and contribute to inflationary pressures. Monitoring real-time port data and freight forwarding rates can offer immediate insights into these pressures.
- Trucking and Rail Rates: Domestic logistics costs, such as trucking and rail rates, reflect internal demand and capacity. Surges in these rates can suggest strong domestic consumption or manufacturing activity, but also indicate potential inflationary cost push for goods reaching consumers.
Inventory Levels
- Inventory-to-Sales Ratios: Analyzing these ratios across retail, wholesale, and manufacturing sectors is crucial. High inventory levels relative to sales might indicate weakening consumer demand or overproduction, potentially leading to future price markdowns or production cuts. Conversely, declining inventories could signal strong demand or supply constraints, which might prompt increased production or lead to upward pricing pressure.
- Finished Goods vs. Raw Material Inventories: Tracking the composition of inventories can also be insightful. A buildup of raw materials alongside dwindling finished goods might point to production bottlenecks, while an abundance of finished goods suggests a possible slowdown in demand.
Manufacturing and Production Metrics
- Purchasing Managers’ Index (PMI) Components: The PMI surveys provide a wealth of information. Specifically, look at:
- New Orders: A leading indicator of future production demand.
- Production: Reflects current manufacturing output.
- Supplier Deliveries: Longer delivery times (higher numbers) suggest supply bottlenecks or strong demand, while shorter times indicate improved supply or weaker demand.
- Inventories: Manufacturers’ inventory levels for both raw materials and finished goods.
- Industrial Production: This measures the output of factories, mines, and utilities. Sustained increases typically align with economic expansion, while declines can signal contraction.
Commodity Prices
Prices of key raw materials such as crude oil, industrial metals (e.g., copper, aluminum), and agricultural products serve as fundamental inputs for many industries. Significant price fluctuations in these commodities can ripple through supply chains, affecting production costs and, ultimately, consumer prices. For instance, rising energy costs directly impact transportation expenses for nearly all goods, contributing to overall inflation.
Labor Market Data
The availability and cost of labor within logistics, manufacturing, and transportation sectors are vital indicators. Shortages of truck drivers, warehouse workers, or manufacturing personnel can lead to significant bottlenecks and wage inflation. Monitoring specific employment statistics and wage growth in these areas can highlight potential friction points in the supply chain that could impact overall economic efficiency and corporate profitability.
Connecting Supply Chain Signals to Market Movements
Interpreting these indicators is not about isolated data points but understanding their interconnectedness and implications for broader market dynamics.
Inflationary Pressures
Disruptions that lead to increased shipping costs, higher commodity prices, or elevated labor expenses within supply chains often translate into higher input costs for businesses. These costs can then be passed on to consumers, contributing to inflation. Conversely, improving supply chain efficiency and reduced bottlenecks can alleviate price pressures, potentially signaling a deceleration in inflation.
Corporate Earnings and Profitability
Companies heavily reliant on global supply chains are directly impacted by their performance. Efficient and stable supply chains contribute to higher profit margins by reducing operational costs and ensuring timely product availability. Conversely, disruptions can lead to increased costs, lost sales, and reduced profitability, which may be reflected in corporate earnings reports and stock valuations, particularly for sectors like retail, manufacturing, and consumer discretionary.
Economic Growth Indicators
Robust and free-flowing supply chains are generally conducive to strong economic growth. Indicators showing healthy demand (e.g., high new orders, falling finished goods inventories) and efficient delivery (e.g., improving supplier delivery times) often precede periods of economic expansion. Conversely, widespread bottlenecks and declining trade volumes can signal an economic slowdown.
Sector-Specific Insights
Different market sectors are affected unevenly. For example, a tightening supply of semiconductors might disproportionately impact technology and automotive industries, affecting their production capacity and stock performance. Understanding these sector-specific sensitivities allows for more nuanced market analysis.
The 2026 Context: Specific Considerations
As of 2026, several overarching themes continue to shape supply chain dynamics:
- Geopolitical Realignment: Ongoing geopolitical tensions mean that businesses are continually re-evaluating sourcing strategies, sometimes leading to higher costs for increased security and reliability. Market analysts often consider how these shifts could impact specific industries or national economies.
- Technological Integration: The push for greater digitalization and automation within supply chains is a key trend. While promising long-term efficiencies, initial investments and the complexity of integration can create short-term disruptions or cost increases.
- Sustainability Imperatives: Growing regulatory and consumer pressure for sustainable practices means companies are scrutinizing their supply chains for environmental and social impact. This can influence material sourcing, manufacturing processes, and logistics choices, potentially affecting costs and lead times.
- Cybersecurity Risks: With increased digitalization comes an elevated risk of cyberattacks targeting supply chain infrastructure. Successful attacks can cause significant operational disruptions, leading to delays and financial losses that ripple across markets.
Conclusion
In 2026, the ability to interpret supply chain indicators is an invaluable skill for those seeking to understand and anticipate market movements. By monitoring freight data, inventory levels, manufacturing metrics, commodity prices, and labor trends, alongside the broader geopolitical and technological landscape, individuals can gain a more comprehensive perspective on economic health and potential market shifts. Remember, no single indicator tells the whole story; a holistic approach that considers multiple data points provides the most robust insights for navigating the complexities of modern markets.
Disclaimer: This article is provided for general informational and educational purposes only and does not constitute financial, investment, trading, or legal advice. Gainsium is not a registered investment advisor. Markets are volatile and past performance does not guarantee future results. Readers should conduct their own research and consult a licensed financial advisor before making any investment decisions.