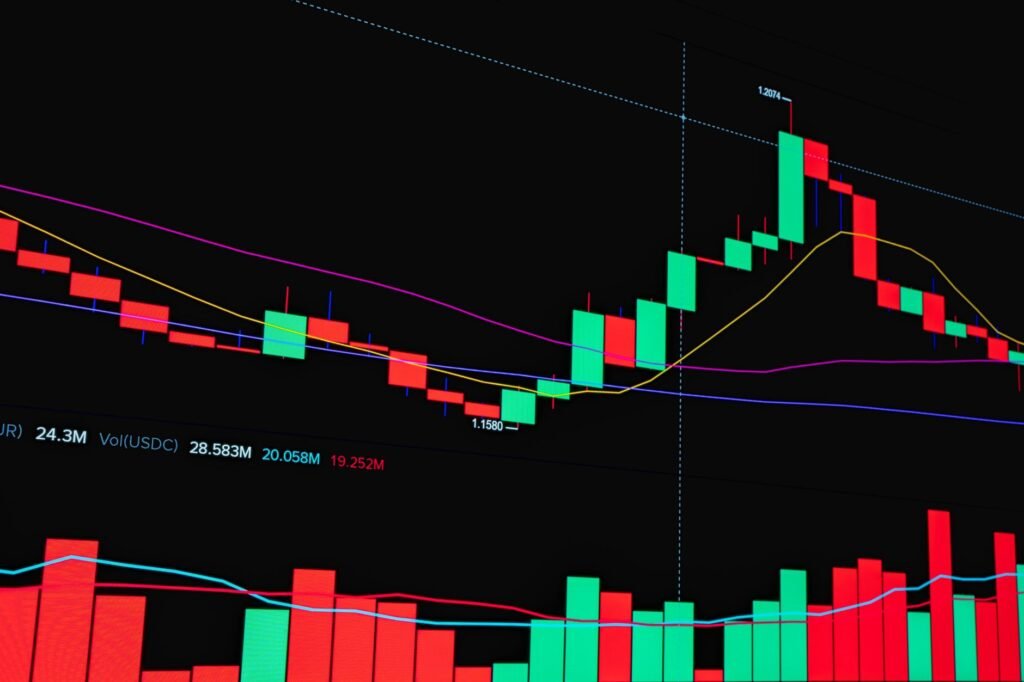

Understanding market sentiment and potential price reversals is a critical skill for any market participant. The Relative Strength Index (RSI) is a popular momentum oscillator that can assist in this endeavor. This guide will provide a beginner’s introduction to the RSI, explaining how it works and how market participants can use it as a technical analysis tool to identify potential overbought and oversold conditions in financial markets.
What is the Relative Strength Index (RSI)?
The Relative Strength Index (RSI) is a momentum oscillator developed by J. Welles Wilder Jr. It measures the speed and change of price movements. RSI oscillates between zero and 100, and it is primarily used to identify overbought or oversold conditions in an asset’s price, potentially signaling an impending reversal or correction. Unlike some other indicators, RSI specifically focuses on the internal strength of an asset’s price action.
At its core, the RSI calculation involves comparing the average gains during periods when an asset’s price increased to the average losses during periods when its price decreased. This comparison is typically smoothed over a specific period, most commonly 14 periods (e.g., 14 days for daily charts, 14 hours for hourly charts). The resulting number is then transformed into an index ranging from 0 to 100, providing a normalized view of momentum.
Interpreting RSI: Overbought and Oversold Conditions
The primary use of the RSI is to identify when an asset may be overbought or oversold. These conditions suggest that the price has moved too far, too fast, and could be due for a reversal or consolidation.
Identifying Overbought Conditions
An asset is generally considered overbought when its RSI reading rises above 70. This level indicates that the asset has experienced strong buying pressure over the chosen period, and its price may be unsustainably high. While an overbought reading does not guarantee an immediate price decline, it signals that the upward momentum might be reaching an extreme. Some market participants interpret an RSI above 70 as a cautionary sign, suggesting that a correction or at least a slowdown in the uptrend could be forthcoming.
For instance, in the dynamic markets of 2026, characterized by varied sector performance and rapid technological shifts, identifying when a stock or cryptocurrency has become excessively bought up can be particularly valuable. An RSI crossing 70 might prompt a market participant to scrutinize other indicators or fundamental news before making decisions.
Identifying Oversold Conditions
Conversely, an asset is generally considered oversold when its RSI reading falls below 30. This indicates that the asset has experienced significant selling pressure, and its price may be unsustainably low. An oversold reading suggests that the downward momentum might be exhausted. For some, an RSI below 30 can be a signal that a rebound or at least a pause in the downtrend may occur.
It is important to remember that in a strong, sustained trend, the RSI can remain in overbought or oversold territory for extended periods. For example, during a robust bull market, an asset’s RSI might hover above 70 for weeks, only dropping below it when a significant correction is truly underway. Similarly, in a powerful bear market, the RSI can stay below 30. Therefore, while these thresholds are valuable, they are best used in conjunction with other analysis tools and market context.
Applying RSI in Market Analysis
Beyond simple overbought/oversold signals, the RSI can provide deeper insights into market dynamics through divergence, trend confirmation, and failure swings.
RSI Divergence
One of the most powerful signals provided by the RSI is divergence, which occurs when the price of an asset and the RSI move in opposite directions. Divergence often precedes a significant price reversal and is considered a stronger signal than simply overbought or oversold readings.
- Bullish Divergence: This occurs when an asset’s price makes a lower low, but the RSI makes a higher low. This suggests that despite the price falling to a new low, the selling momentum is actually weakening. Market participants might interpret this as a potential sign that the downtrend is losing steam and a bullish reversal could be imminent.
- Bearish Divergence: This occurs when an asset’s price makes a higher high, but the RSI makes a lower high. This indicates that even though the price is reaching new highs, the buying momentum is declining. This could signal that the uptrend is weakening, and a bearish reversal might be approaching.
Identifying divergence requires careful observation and can be particularly useful in volatile environments, which have been observed periodically in 2026 across various asset classes. When using divergence, it is crucial to wait for confirmation from price action or other indicators before acting on the signal.
RSI for Trend Confirmation and Failure Swings
The RSI can also be used to confirm the strength of a trend or to identify potential trend failures.
- In an uptrend, the RSI will generally remain above 50, often bouncing off this level after brief dips. If the RSI consistently fails to reach 70 during price rallies or dips below 50 significantly, it could indicate weakening momentum in the uptrend.
- In a downtrend, the RSI will typically stay below 50, often bumping up against it before falling further. If the RSI consistently fails to reach 30 during price declines or rises above 50, it might suggest weakening momentum in the downtrend.
Failure swings are another pattern to look for. A bullish failure swing occurs when the RSI dips below 30, rises above 30, then pulls back but stays above its previous low before moving higher again. This can be a strong indication of a developing uptrend. A bearish failure swing is the inverse, signaling a potential downtrend.
Confluence with Other Indicators
For more robust analysis, the RSI is often used in conjunction with other technical indicators. Combining RSI with tools like moving averages, Bollinger Bands, or support and resistance levels can help validate signals and reduce false positives. For example, an RSI overbought signal combined with price reaching a significant resistance level, or a bearish divergence occurring while an asset breaks below a key moving average, can provide a stronger indication of a potential reversal.
Considerations and Limitations of RSI
While the RSI is a powerful tool, it is not without its limitations. Market participants should be aware of these to use the indicator effectively.
False Signals in Strong Trends
As mentioned, during very strong trends, the RSI can remain in overbought or oversold territory for extended periods. In such cases, relying solely on the 70/30 thresholds can lead to premature exits from profitable trades or early entries into losing ones. This is especially relevant in modern markets where momentum-driven rallies or sell-offs can be particularly intense, as has been seen with various asset classes in 2026.
Not Predictive on its Own
The RSI is a lagging indicator, meaning it is derived from past price action. It does not predict future prices with certainty but rather measures the momentum of current and past price movements. It should always be used as part of a broader analytical framework rather than as a standalone crystal ball.
Customization and Timeframes
The default 14-period setting for RSI is a widely used standard, but market participants can customize this period to suit different strategies or asset types. A shorter period (e.g., 7 periods) will make the RSI more sensitive to price changes, resulting in more frequent overbought/oversold signals, which may be beneficial for short-term analysis. A longer period (e.g., 21 periods) will make the RSI smoother and less volatile, generating fewer but potentially more significant signals, which might be preferred for longer-term perspectives.
In conclusion, the Relative Strength Index (RSI) is an invaluable tool for understanding market momentum and identifying potential reversals. By grasping its core principles, recognizing overbought and oversold conditions, and understanding the significance of divergence, market participants can enhance their market analysis. However, like all technical indicators, the RSI is most effective when used in combination with other forms of analysis and within a comprehensive understanding of market context, including the dynamic and often volatile conditions observed in 2026.
Disclaimer: This article is provided for general informational and educational purposes only and does not constitute financial, investment, trading, or legal advice. Gainsium is not a registered investment advisor. Markets are volatile and past performance does not guarantee future results. Readers should conduct their own research and consult a licensed financial advisor before making any investment decisions.