
In the fast-paced world of day trading, timely and granular market information is paramount. Understanding how to interpret Level 2 market data can provide a significant edge, offering a window into the immediate supply and demand dynamics that drive price action. For day traders navigating the complex markets of 2026, mastering Level 2 data remains a crucial skill for making more informed decisions.
What is Level 2 Market Data?
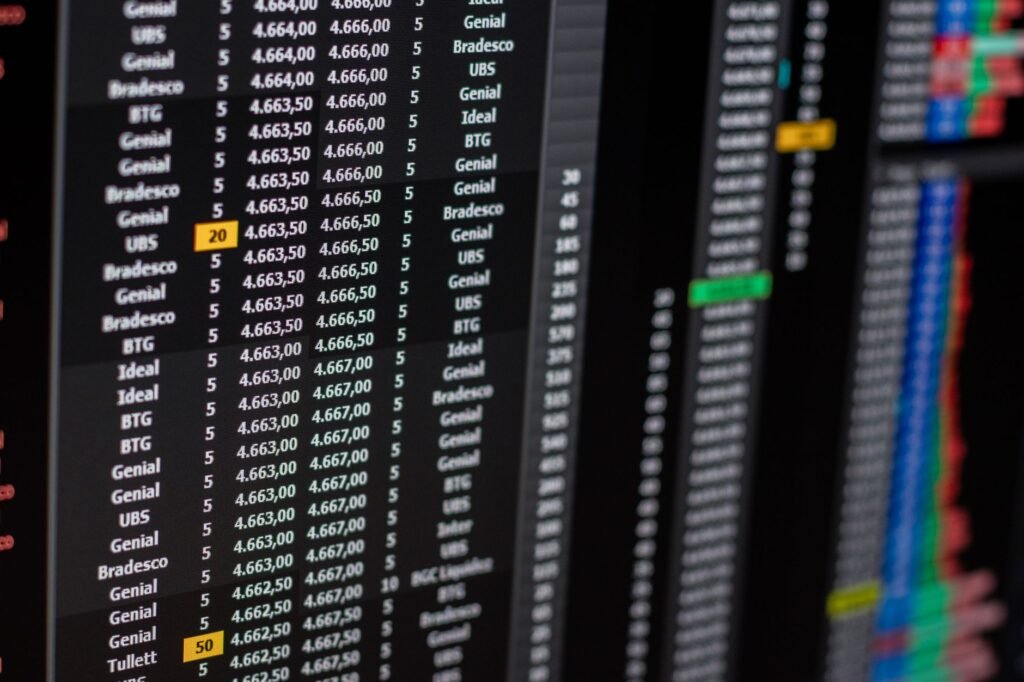
Level 2 market data provides a detailed, real-time view of an exchange’s electronic order book beyond just the best bid and ask prices. While Level 1 data typically shows only the highest bid and the lowest ask, along with their respective sizes, Level 2 expands on this by displaying multiple bid and ask price levels, often across various market makers or participants. Each entry typically includes the price, the size (number of shares or contracts), and the market participant or exchange offering that price.
The Evolution of Market Transparency
Historically, market access was opaque, largely controlled by specialists or market makers. The advent of electronic trading and regulations like the SEC’s Order Handling Rules in the late 1990s dramatically increased transparency, leading to the public availability of Level 2 data. By 2026, while market structure has further evolved with significant algorithmic participation and continued fragmentation across numerous exchanges and alternative trading systems (ATSs), Level 2 data still offers critical insights into the immediate liquidity landscape on publicly displayed exchanges.
Interpreting Level 2 Components
To effectively utilize Level 2 data, a day trader must understand its core components and how they interact.
Bid and Ask Depth
- Bid Side: On the left side of the Level 2 screen, the bid column shows the prices at which buyers are willing to purchase shares. The highest price is at the top, representing the best bid. Below it are progressively lower prices with corresponding bid sizes. Large quantities at specific bid prices can indicate support levels, where significant buying interest exists.
- Ask Side: On the right, the ask column displays the prices at which sellers are willing to sell. The lowest price is at the top, representing the best ask. Below it are progressively higher prices with corresponding ask sizes. Substantial quantities at certain ask prices may signify resistance levels, where significant selling pressure is present.
Order Book Dynamics
Observing the changes in bid and ask sizes and prices provides a real-time pulse of market sentiment. Traders look for:
- Liquidity: Densely populated bid and ask columns indicate high liquidity, suggesting easy entry and exit without significant price impact. Thinly populated columns point to illiquidity, where larger orders could cause price volatility.
- Order Flow: The constant flashing and updating of orders reveal the aggression of buyers and sellers. Rapid increases in bid sizes or decreases in ask sizes can signal increasing buying pressure, while the opposite indicates selling pressure.
- Bid/Ask Walls: These are unusually large orders placed at a specific price level, forming a visible “wall” that can temporarily halt price movement. A large bid wall below the current price suggests strong potential support, while a large ask wall above indicates potential resistance. However, experienced traders in 2026 understand that these walls can sometimes be “spoofing” orders—large orders placed with the intent to mislead other traders, which are then pulled before execution.
Understanding “Hidden” Liquidity
It is important for traders in 2026 to acknowledge that Level 2 data does not present the complete picture of market liquidity. A significant portion of trading volume, particularly for institutional investors, occurs in “dark pools” or off-exchange venues, which are not visible on Level 2 screens. This means that while Level 2 provides excellent insight into displayed liquidity, it does not show all potential buying or selling interest. The fragmentation of markets and the prevalence of sophisticated algorithmic trading further complicate the full interpretation of market depth.
Practical Applications for Day Trading in 2026
For day traders, Level 2 data can inform various strategic decisions.
Identifying Support and Resistance
Persistent large bids at a specific price suggest a strong support level, while large asks indicate resistance. Traders can use these insights to plan entry points near perceived support or exit points near resistance, often combining this with technical analysis for confirmation.
Gauging Momentum and Order Flow
Observing the speed and size of orders being placed and executed can help gauge immediate momentum. If bids are being hit aggressively and ask prices are rising quickly, it suggests strong upward momentum. Conversely, if asks are being filled rapidly and bid prices are dropping, downward momentum is likely in play. Monitoring the “tape” (time and sales data) alongside Level 2 provides a comprehensive view of executed orders.
Executing Trades Strategically
Level 2 assists in determining optimal entry and exit prices. For instance, a trader looking to buy might place an order just above a strong bid wall, anticipating the price will bounce. Alternatively, to sell, an order might be placed just below a significant ask wall. Observing the liquidity on both sides helps in placing limit orders that are more likely to be filled without moving the market excessively, especially for larger positions. Some trading algorithms actively use Level 2 data to optimize their order placement and execution strategies, a common practice in 2026.
Limitations and Considerations
While invaluable, Level 2 data has limitations:
- Incomplete Picture: As mentioned, off-exchange trading, dark pools, and “iceberg” orders (large orders broken into smaller, visible parts) mean Level 2 doesn’t show all liquidity.
- Speed and Volume: In volatile, high-volume markets, Level 2 updates can be overwhelming, requiring sophisticated tools and quick interpretation.
- Spoofing and Manipulation: The practice of placing large, non-bonafide orders to influence price (spoofing) continues to be a concern, although regulators actively monitor and penalize such activities.
- Algorithms: The dominance of high-frequency trading (HFT) firms means that many Level 2 changes are driven by algorithms, which can react much faster than human traders.
In 2026, Level 2 market data remains a powerful tool for day traders seeking an edge. By meticulously interpreting its components—from bid/ask depth to order flow dynamics—and understanding its limitations within a fragmented, algorithm-driven market, traders can enhance their ability to make timely and informed decisions. Combining Level 2 insights with other forms of technical and fundamental analysis is often recommended for a holistic trading strategy.
Disclaimer: This article is provided for general informational and educational purposes only and does not constitute financial, investment, trading, or legal advice. Gainsium is not a registered investment advisor. Markets are volatile and past performance does not guarantee future results. Readers should conduct their own research and consult a licensed financial advisor before making any investment decisions.