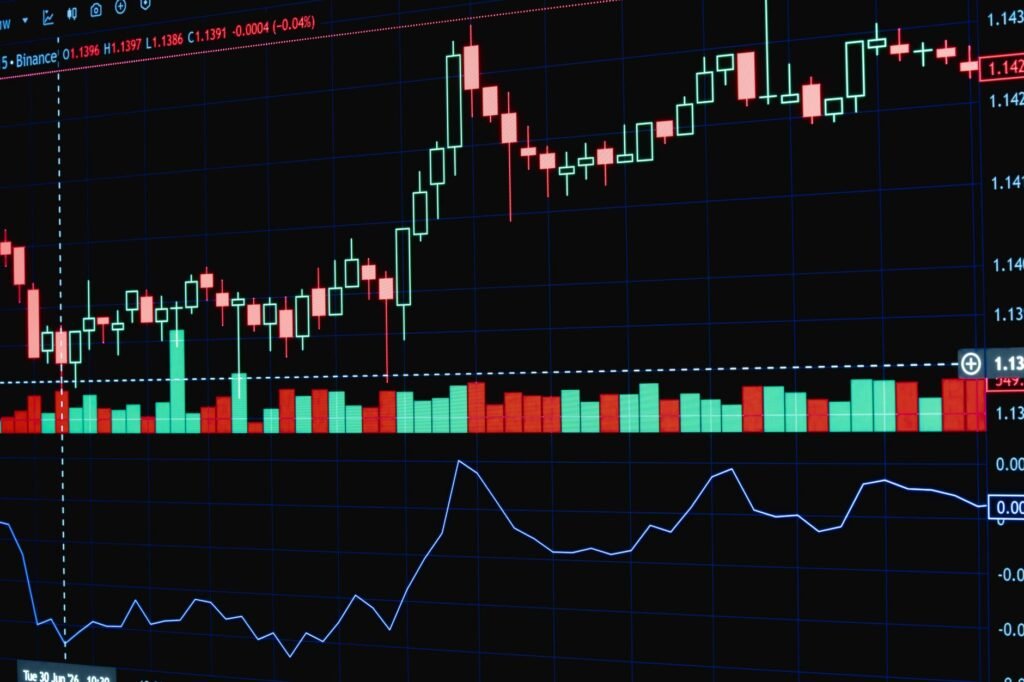

Understanding market trends is a cornerstone of effective trading, and for beginners seeking clarity in dynamic financial landscapes, technical indicators can provide valuable insights. This guide will explain how the Moving Average Convergence Divergence (MACD) indicator works and how traders can utilize it to confirm trend direction and momentum, helping to inform their trading decisions.
In the evolving markets of 2026, where digital assets continue to mature, and traditional markets navigate varied interest rate environments and global economic shifts, reliable tools for technical analysis remain essential. The MACD, a foundational momentum indicator, offers a simplified yet powerful way to gauge market sentiment and the strength of price movements without making speculative future price predictions.
What is the MACD Indicator?
The Moving Average Convergence Divergence (MACD) is a trend-following momentum indicator that shows the relationship between two moving averages of a security’s price. It was developed by Gerald Appel in the late 1970s and has since become one of the most widely used technical analysis tools globally.
At its core, the MACD indicator is designed to reveal shifts in the strength, direction, momentum, and duration of a trend. It consists of three main components:
- MACD Line: This line is typically calculated by subtracting the 26-period Exponential Moving Average (EMA) from the 12-period EMA. It represents the momentum of the security.
- Signal Line: This is a 9-period EMA of the MACD line itself. It acts as a trigger for buy and sell signals.
- Histogram: The histogram visually represents the difference between the MACD line and the Signal line. It provides a visual cue for momentum changes.
These components work in concert to give a comprehensive view of a security’s price momentum. The MACD essentially smooths out price data to identify potential trend changes and their intensity.
How MACD Works: Decoding Its Signals
Understanding how to interpret the signals generated by the MACD indicator is crucial for its effective application in trend confirmation. The primary signals come from the crossovers of its lines and the behavior of the histogram.
MACD Line and Signal Line Crossovers
Crossovers between the MACD line and the Signal line are often interpreted as potential trading signals:
- Bullish Crossover: When the MACD line crosses above the Signal line, it can suggest increasing upward momentum. This is often seen as a bullish signal, indicating that the short-term average is moving away from the longer-term average in an upward direction, potentially confirming an uptrend or the start of one.
- Bearish Crossover: Conversely, when the MACD line crosses below the Signal line, it can indicate weakening upward momentum or increasing downward momentum. This is generally considered a bearish signal, suggesting that the short-term average is falling faster than the longer-term average, potentially confirming a downtrend or the start of one.
The reliability of these crossovers is often enhanced when they occur in conjunction with the MACD line’s position relative to the zero line. Crossovers occurring above the zero line in a rising trend are generally viewed as stronger bullish signals, while those below the zero line in a falling trend are often seen as stronger bearish signals.
The MACD Histogram
The histogram provides a visual representation of the distance between the MACD line and the Signal line. Its behavior offers insights into the strength and acceleration of momentum:
- When the histogram bars are positive and growing (above the zero line and increasing in height), it indicates that the MACD line is moving further above the Signal line, suggesting strengthening upward momentum.
- When the histogram bars are negative and growing (below the zero line and increasing in depth), it shows the MACD line is moving further below the Signal line, indicating strengthening downward momentum.
- When the histogram bars are shrinking (moving closer to the zero line from either positive or negative territory), it can signal that the prevailing momentum is slowing down, potentially preceding a crossover and a trend reversal.
Divergence: A Warning Sign
Another powerful signal from the MACD is divergence. Divergence occurs when the price of a security moves in one direction while the MACD indicator moves in the opposite direction. This often serves as a warning that the current trend may be losing strength and a reversal could be imminent.
- Bullish Divergence: If the price makes a lower low, but the MACD makes a higher low, it’s a bullish divergence. This suggests that despite the price making new lows, the selling momentum is weakening, potentially foreshadowing an upward reversal.
- Bearish Divergence: If the price makes a higher high, but the MACD makes a lower high, it’s a bearish divergence. This indicates that despite the price making new highs, the buying momentum is weakening, potentially preceding a downward reversal.
It is important to remember that divergence is a warning signal, not a direct entry or exit signal. It typically prompts traders to look for additional confirmation from other indicators or price action before making a decision.
Using MACD for Trend Confirmation in Trading
The primary utility of the MACD for beginners lies in its ability to confirm existing trends and provide early warnings of potential trend reversals. It is rarely used in isolation but rather as part of a broader technical analysis strategy.
Confirming Upward Trends
When seeking to confirm an upward trend, traders often look for several coinciding signals from the MACD:
- The MACD line is above the zero line, indicating overall bullish momentum.
- The MACD line is above the Signal line, suggesting that short-term momentum is stronger than its average.
- The histogram bars are positive and potentially increasing, reinforcing the strength of the upward momentum.
These conditions together can provide strong confirmation that an asset is in a sustained uptrend. For instance, in 2026, amidst a generally bullish market sentiment for specific technology sectors, observing these MACD characteristics could reinforce a trader’s assessment of an existing upward price movement.
Confirming Downward Trends
Conversely, for confirming a downward trend, traders typically look for these MACD characteristics:
- The MACD line is below the zero line, indicating overall bearish momentum.
- The MACD line is below the Signal line, suggesting that short-term momentum is weaker than its average.
- The histogram bars are negative and potentially increasing in depth, reinforcing the strength of the downward momentum.
When these signals align, they can confirm that an asset is experiencing a sustained downtrend. This can be particularly useful in environments where market corrections are underway, helping traders confirm the strength of downward pressure.
Combining MACD with Other Technical Tools
While the MACD is a robust indicator, its effectiveness is significantly enhanced when used in conjunction with other technical analysis tools. No single indicator should be relied upon exclusively. Here are some common combinations:
- Price Action: Always observe the actual price movements, including support and resistance levels, candlestick patterns, and chart patterns. MACD signals gain strength when confirmed by clear price action.
- Volume: Increasing volume during MACD-confirmed breakouts or breakdowns adds further conviction to the trend.
- Other Moving Averages: Using longer-term moving averages (e.g., 50-period, 200-period Simple Moving Averages) can help identify the overarching trend, providing context for MACD signals.
- Relative Strength Index (RSI): The RSI can help confirm overbought or oversold conditions, complementing MACD’s momentum signals.
By integrating MACD with a broader analytical framework, traders can build more robust strategies for trend confirmation and risk management. This approach helps to filter out false signals and provides a more comprehensive picture of market dynamics, which is crucial in any market environment, including the diverse conditions seen in 2026.
Important Considerations and Limitations
While the MACD is a powerful tool, it’s important to understand its limitations:
- Lagging Indicator: Like all indicators derived from moving averages, the MACD is a lagging indicator. It uses past price data, meaning it confirms a trend after it has already begun, rather than predicting its start.
- False Signals in Choppy Markets: In markets without a clear trend (sideways or choppy markets), the MACD can generate numerous false crossovers, leading to whipsaws and potential losses if not used carefully.
- Not a Predictive Tool: The MACD confirms momentum and trend direction; it does not predict future price levels or guarantee outcomes. The financial markets are inherently unpredictable, and past performance, as indicated by MACD, is not indicative of future results.
- Parameter Sensitivity: The standard 12, 26, 9-period settings are widely used, but adjusting these parameters can alter the sensitivity of the indicator, potentially making it more responsive or smoother. However, traders should thoroughly backtest any changes to ensure they are appropriate for their specific trading style and the asset being analyzed.
As with any financial tool, continuous learning, practice, and the application of sound risk management principles are paramount. Income potential from trading varies widely based on experience, market conditions, and time invested, and it is crucial to approach trading with a clear understanding of the risks involved.
Conclusion
The MACD indicator is a versatile and widely used technical analysis tool that can be invaluable for beginner traders looking to confirm trend direction and momentum. By understanding its components – the MACD line, Signal line, and Histogram – and interpreting their crossovers and divergences, traders can gain deeper insights into market behavior. However, its true power is unlocked when used in conjunction with other technical indicators and robust price action analysis, never in isolation. Always remember that the MACD, like all indicators, is a tool for analysis, not a crystal ball for guaranteed returns, especially in the ever-evolving financial landscapes of 2026 and beyond. Integrating it into a comprehensive trading strategy, combined with diligent risk management, forms a strong foundation for informed decision-making.
Disclaimer: This article is provided for general informational and educational purposes only and does not constitute financial, investment, trading, or legal advice. Gainsium is not a registered investment advisor. Markets are volatile and past performance does not guarantee future results. Readers should conduct their own research and consult a licensed financial advisor before making any investment decisions.