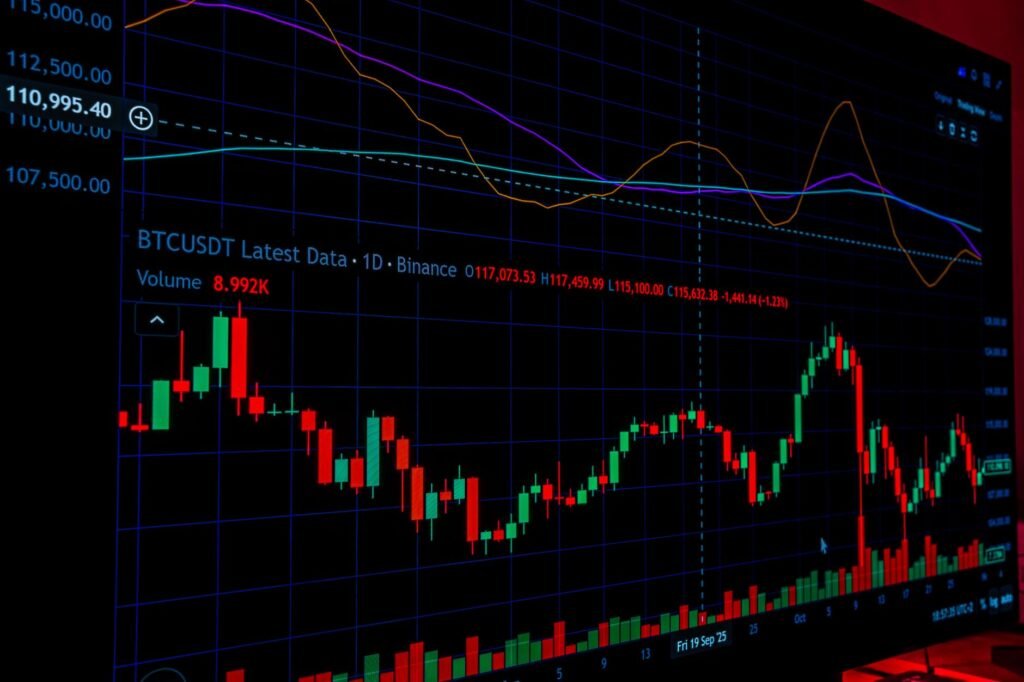

In the dynamic world of financial markets, technical analysis is a cornerstone for many seeking to understand price movements. While price charts provide crucial information, combining them with volume analysis can offer a significantly deeper insight, helping traders make more informed decisions. By integrating volume indicators, market participants can identify stronger market trends, anticipate potential reversals, and confirm the validity of price movements, enhancing their overall analytical framework.
Understanding Volume Analysis: The Basics
Trading volume represents the total number of shares, contracts, or units of a particular security or asset that have been traded over a specific period. It is a fundamental component of technical analysis because it measures the conviction behind a price move. High volume indicates strong interest and participation, while low volume suggests a lack of interest or indecision.
Understanding the interplay between price and volume is essential:
- High Volume on Price Increases: Often signifies strong buying pressure and conviction, confirming an uptrend.
- Low Volume on Price Increases: May suggest a weak rally or a lack of genuine demand, potentially indicating a false breakout or an impending reversal.
- High Volume on Price Decreases: Typically points to strong selling pressure and conviction, confirming a downtrend.
- Low Volume on Price Decreases: Could signal weak selling pressure, suggesting that a downtrend is losing momentum or that a pullback is temporary.
Key Volume Indicators and Their Applications
Several technical indicators are designed to interpret volume data, providing quantifiable insights into market sentiment and trend strength.
On-Balance Volume (OBV)
OBV is a momentum indicator that relates volume to price change. It’s a running total of positive and negative volume. When a security’s closing price is higher than the previous close, all of that day’s volume is added to the OBV total. If the price closes lower, the volume is subtracted. The idea is that volume precedes price, so a rising OBV indicates increasing buying pressure that could push prices higher, and vice versa.
Accumulation/Distribution Line (A/D Line)
The A/D Line measures the cumulative flow of money into or out of a security. It does this by taking the security’s daily trading range and where the closing price falls within that range, then multiplying it by the day’s volume. A rising A/D Line suggests accumulation (buying pressure), while a falling line indicates distribution (selling pressure).
Volume Price Trend (VPT)
Similar to OBV, the VPT indicator calculates a running total of volume, but the added or subtracted volume is weighted by the percentage change in the security’s price. This makes VPT more sensitive to price movements than OBV, and it can be used to confirm trends and identify divergences.
Chaikin Money Flow (CMF)
CMF combines price and volume to measure buying and selling pressure over a specified period, typically 20 or 21 days. It indicates whether a security is under accumulation (buying pressure) or distribution (selling pressure) by calculating where the closing price falls within the day’s high/low range, then multiplying by volume. A positive CMF suggests accumulation, and a negative CMF suggests distribution.
Integrating Volume with Price Action: Strategies
Volume analysis is most powerful when combined with price action, offering a more complete picture of market dynamics.
Confirming Trends
- Strong Uptrends: A healthy uptrend often shows rising prices accompanied by high volume during upward movements, and low volume during pullbacks or consolidations. This suggests that buyers are eager to enter or add to positions on strength, while selling pressure is minimal during retracements.
- Strong Downtrends: Conversely, a robust downtrend typically involves falling prices on high volume and low volume during relief rallies. This indicates strong selling conviction, with limited buying interest on temporary price increases.
Identifying Reversals
- Exhaustion Volume: A sudden, dramatic spike in volume at extreme price levels (e.g., a new high or low) can signal market exhaustion. This often occurs when the last buyers or sellers capitulate, potentially preceding a trend reversal.
- Volume Divergence: If price makes a new high but a volume indicator (like OBV or A/D Line) fails to make a new high, it can signal a weakening of the trend and a potential reversal. The same applies to price making a new low without a corresponding new low in the volume indicator.
Validating Breakouts and Breakdowns
When a security breaks out of a significant resistance level or breaks down through a crucial support level, volume can confirm the validity of the move. A true breakout or breakdown is often accompanied by a significant surge in volume, indicating strong conviction behind the move. A breakout on low volume might suggest a false signal or a
Disclaimer: This article is provided for general informational and educational purposes only and does not constitute financial, investment, trading, or legal advice. Gainsium is not a registered investment advisor. Markets are volatile and past performance does not guarantee future results. Readers should conduct their own research and consult a licensed financial advisor before making any investment decisions.