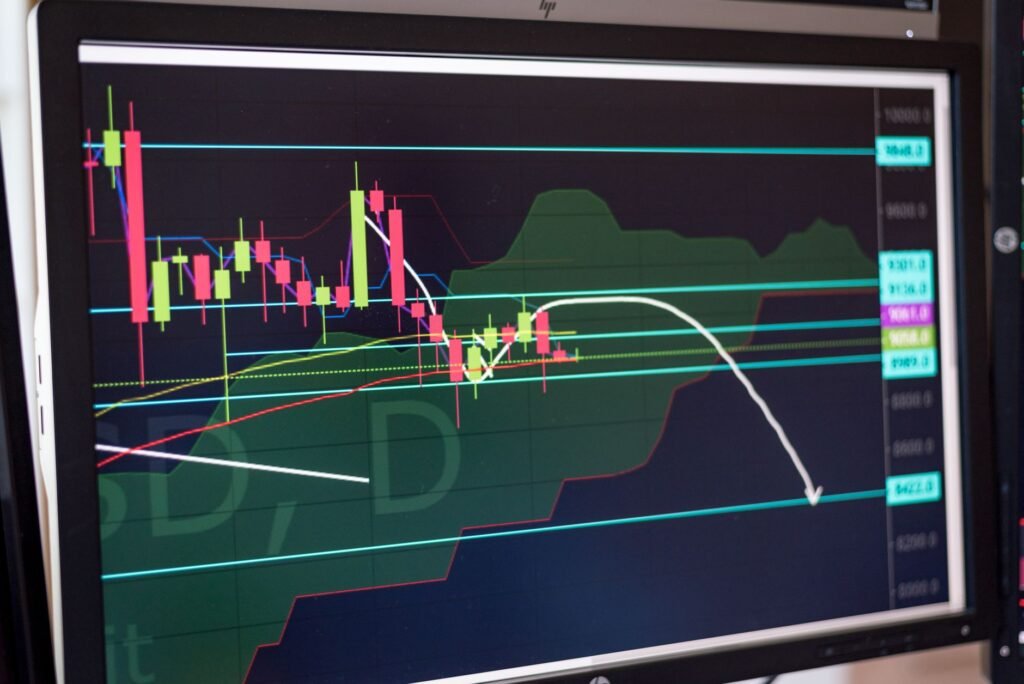

For aspiring day traders, understanding and effectively utilizing technical indicators is a cornerstone of market analysis. One such indicator, the Relative Strength Index (RSI), is a powerful momentum oscillator that can help identify potential overbought and oversold conditions in an asset. This guide will walk beginners through how to interpret and apply RSI within the fast-paced environment of day trading, aiming to enhance their analytical toolkit in the dynamic markets of 2026.
Understanding the Relative Strength Index (RSI)
The Relative Strength Index (RSI) is a momentum oscillator developed by J. Welles Wilder Jr. It measures the speed and change of price movements, oscillating between zero and 100. The primary purpose of RSI is to gauge whether a security is overbought or oversold, potentially signaling a forthcoming price reversal or correction. For day traders, this tool can offer insights into short-term price dynamics.
What is RSI and How it’s Calculated?
At its core, RSI works by comparing the magnitude of recent gains to recent losses over a specified period. The standard setting for RSI is typically 14 periods (e.g., 14 days, 14 hours, or 14 minutes, depending on the chart’s timeframe). When an asset’s price increases, its RSI tends to rise; conversely, when prices fall, RSI declines. The calculation essentially smooths out price changes to provide a clearer picture of momentum.
Key Levels: Overbought and Oversold
The most crucial aspect of RSI interpretation revolves around its extreme values:
- Overbought: An RSI reading of 70 or above typically suggests that an asset may be overvalued or has been bought too aggressively, potentially making it ripe for a downward correction.
- Oversold: An RSI reading of 30 or below generally indicates that an asset may be undervalued or has been sold off too aggressively, potentially signaling an upcoming upward correction.
It is important to remember that these levels are not definitive buy or sell signals but rather indicators of market sentiment and potential areas of interest for further analysis.
Interpreting RSI for Day Trading
Day traders operate on short timeframes, where quick decisions are essential. Interpreting RSI effectively within this context requires a nuanced understanding of its signals and limitations.
Identifying Overbought and Oversold Conditions
When RSI enters overbought (above 70) or oversold (below 30) territory, it serves as a warning flag. In day trading, this might suggest that a rapid price move in one direction could be exhausting itself. For instance, if a stock has surged quickly and its 5-minute RSI crosses above 70, some traders might begin to monitor for signs of weakening momentum or a potential pullback, rather than immediately initiating a short position. Conversely, an asset with a rapid decline and a 5-minute RSI below 30 could signal an opportunity for a bounce.
RSI Divergence: A Stronger Signal
While overbought/oversold levels are useful, RSI divergence can often provide stronger indications of a potential trend reversal. Divergence occurs when the price of an asset moves in one direction, but its RSI moves in the opposite direction.
- Bullish Divergence: This happens when an asset’s price makes a lower low, but the RSI makes a higher low. This can suggest that the selling pressure is weakening, and an upward reversal might be on the horizon.
- Bearish Divergence: This occurs when an asset’s price makes a higher high, but the RSI makes a lower high. This can indicate that the buying momentum is fading, and a downward reversal may be imminent.
Identifying divergence on shorter timeframes (e.g., 5-minute or 15-minute charts) can be particularly valuable for day traders seeking to capitalize on early shifts in momentum.
Strategies for Using RSI in Day Trading
Integrating RSI into a day trading strategy involves more than just looking at the 30 and 70 lines. It requires combining it with other analytical tools and a robust approach to risk management.
Combining RSI with Other Indicators
No single indicator should be used in isolation, especially in the volatile world of day trading. RSI performs best when confirmed by other forms of analysis. Common combinations include:
- Trend Lines and Support/Resistance: If an asset’s RSI is overbought near a strong resistance level, it strengthens the case for a potential reversal. Similarly, an oversold RSI at a significant support level might indicate a good buying opportunity.
- Moving Averages: Traders often look for RSI signals that align with moving average crossovers or price interactions with moving averages. For example, an oversold RSI combined with the price bouncing off a key moving average could be a stronger signal.
- Volume: Confirmation from volume can be crucial. A divergence signal accompanied by decreasing volume in the direction of the current trend can add conviction to the potential reversal.
In the evolving markets of 2026, where algorithmic trading continues to influence price action, leveraging multiple indicators can help filter out noise and identify higher-probability setups.
Risk Management and Timeframes
Effective day trading always prioritizes risk management. Even the most reliable RSI signals can fail, and unexpected news or market events can quickly invalidate technical setups. Therefore, implementing strict stop-loss orders and appropriate position sizing is paramount.
For day trading, shorter timeframes (e.g., 1-minute, 5-minute, 15-minute charts) are generally used. It’s important to note that RSI on these shorter timeframes can be much more volatile and prone to
Disclaimer: This article is provided for general informational and educational purposes only and does not constitute financial, investment, trading, or legal advice. Gainsium is not a registered investment advisor. Markets are volatile and past performance does not guarantee future results. Readers should conduct their own research and consult a licensed financial advisor before making any investment decisions.