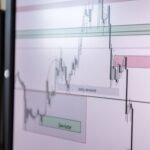

Volume Profile analysis is a potent tool for day traders aiming to understand market sentiment and structure at specific price levels. It visually represents trading activity across different prices over a specified period, offering deep insights into where significant volume has occurred. Unlike traditional volume indicators that display total volume over time, Volume Profile maps volume directly onto price, thereby revealing precise areas of agreement and disagreement among market participants.
What is Volume Profile Analysis?
Volume Profile analysis constructs a horizontal histogram of trading volume at each individual price level within a given timeframe. Instead of viewing volume as a vertical bar for a particular time period, it presents a side-on view, stacking the volume traded at each price point. This allows day traders to visualize where the majority of transactions have taken place, indicating areas of high liquidity and market acceptance.
The primary purpose of Volume Profile is to identify areas of institutional interest, supply and demand zones, and potential levels of support and resistance that are driven by actual trading activity rather than just price movement. In the highly data-driven market environment of 2026, where algorithmic trading systems account for a substantial portion of market activity, tools that accurately visualize order flow and liquidity like Volume Profile have become increasingly valuable for discretionary traders seeking an edge.
Key Components of a Volume Profile
Understanding the core components of a Volume Profile is crucial for effective application in day trading:
- Point of Control (POC): This is the single price level within the profile where the highest amount of trading volume occurred. The POC is often considered the “fair value” or equilibrium point for the period, indicating where the market found the most agreement. It frequently acts as a magnetic price level or a strong pivot point for future price action.
- Value Area (VA): The Value Area represents the price range where a specified percentage of the total volume was traded, typically 70%. This zone signifies where the majority of market participants were willing to transact. Prices trading within the Value Area suggest a balanced or consolidating market, while prices moving outside can signal a potential trend or shift in market sentiment.
- High Volume Nodes (HVNs): HVNs are distinct price levels or clusters within the profile where significantly high trading volume occurred. These nodes indicate strong areas of agreement among traders and often act as robust support or resistance zones. When price approaches an HVN, it might consolidate, reverse, or experience a battle between buyers and sellers. A break below an HVN could lead to an accelerated move to the next significant level.
- Low Volume Nodes (LVNs): Conversely, LVNs are price levels or gaps within the profile where significantly low trading volume occurred. These indicate areas of disagreement or rapid price movement, often referred to as “air pockets.” Prices tend to move quickly through LVNs as there is little resistance or support. They can act as areas where price might reverse if it consolidates, or where breakouts gain significant momentum due to a lack of opposing interest.
Applying Volume Profile in Day Trading
Day traders utilize Volume Profile to inform various aspects of their trading strategy, from identifying key levels to formulating entry and exit points:
Identifying Support and Resistance
Volume Profile provides a dynamic and volume-weighted view of support and resistance. HVNs often serve as strong magnets and potential turning points; price might consolidate around these levels before making a decisive move. Conversely, LVNs are frequently “air pockets” where price tends to move swiftly, making them ideal targets once broken. The POC can act as a crucial pivot point: a sustained move above a previous session’s POC might signal bullish sentiment, while a move below suggests a bearish bias.
Assessing Market Structure and Trend
The overall shape of the Volume Profile can offer insights into market structure. A “P” or “b” shaped profile often indicates a trending market followed by consolidation, whereas a “D” or “bell” shaped profile suggests a balanced or consolidating market. By understanding the evolving profile shape, traders can gauge market acceptance of price levels and anticipate potential shifts in direction. For example, during periods of heightened volatility, such as those observed in certain high-growth technology sectors in 2025-2026, volume profile can highlight where liquidity concentrations may exist, aiding in risk management.
Entry and Exit Strategies
Traders might look to enter long positions near HVN support zones, targeting subsequent LVNs or previous POCs as profit targets. Short entries could be considered near HVN resistance zones. Stop-loss orders can be strategically placed just outside the Value Area or above/below a strong POC, aiming to minimize risk. Volume Profile helps traders identify where significant orders might be sitting, potentially leading to more precise entry and exit points.
Confirmation with Other Indicators
While powerful, Volume Profile is most effective when used in conjunction with other technical analysis tools. Combining it with moving averages, Relative Strength Index (RSI), candlestick patterns, or even fundamental news analysis can provide a more robust trading edge. No single indicator provides a complete picture, especially given the increasing complexity of market participants, including high-frequency trading firms and sophisticated algorithms.
Considerations and Limitations
Like all analytical tools, Volume Profile analysis has its specific considerations and limitations:
- Timeframe Dependency: A Volume Profile is inherently timeframe-specific. An intraday profile (e.g., 30-minute or 60-minute) will present different insights than a daily or weekly profile. Day traders must select a timeframe that aligns with their trading style and objectives.
- Dynamic Nature: Volume Profiles are not static; they continuously evolve as trading activity unfolds. Traders need to constantly re-evaluate the profile’s shape and its key components throughout the trading day.
- Lagging Indicator: Volume Profile shows where volume has occurred, not necessarily where it will occur. While it provides a comprehensive map of historical interest, future price action is never guaranteed.
- Context is Key: Always consider the broader market context, significant economic news releases, and fundamental drivers alongside technical analysis. A major earnings report or a shift in monetary policy can drastically alter market dynamics, potentially rendering historical volume profiles less immediately relevant.
- Not a Holy Grail: Volume Profile is a tool to aid decision-making, not a guarantee of success. Effective risk management, disciplined execution, and continuous learning remain paramount for day traders. The dynamic nature of markets means that even the most advanced tools must be used with a critical and adaptable mindset.
Disclaimer: This article is provided for general informational and educational purposes only and does not constitute financial, investment, trading, or legal advice. Gainsium is not a registered investment advisor. Markets are volatile and past performance does not guarantee future results. Readers should conduct their own research and consult a licensed financial advisor before making any investment decisions.