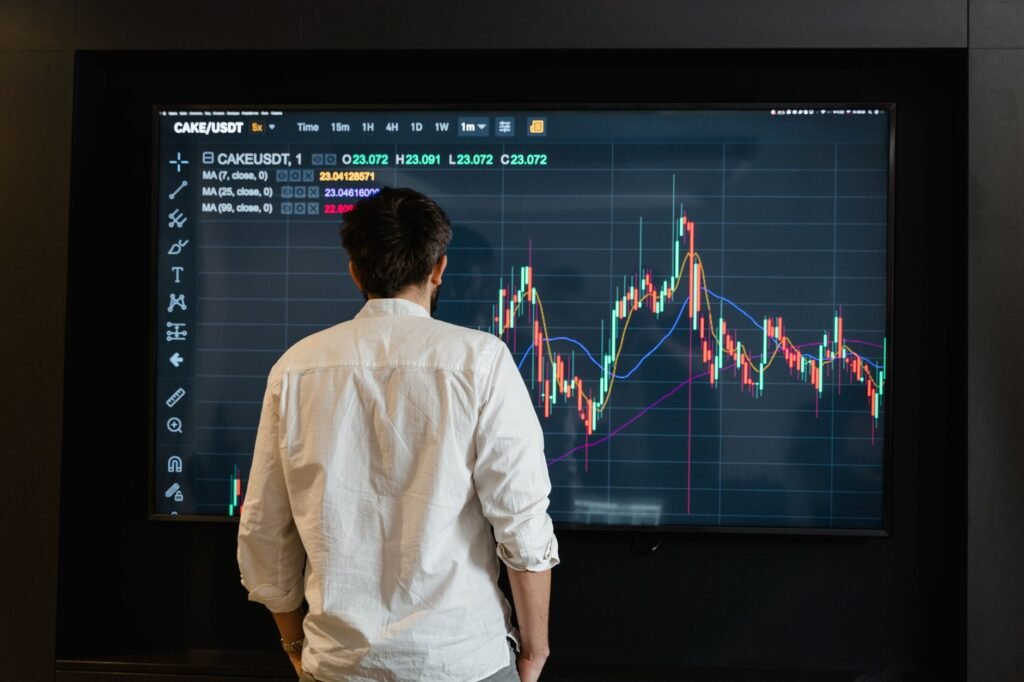

For beginner traders navigating the dynamic financial markets of 2026, understanding technical indicators is a crucial step towards making informed decisions. This guide will introduce seven fundamental technical indicators, explaining how each is calculated and used to identify trends, gauge momentum, and pinpoint potential entry and exit points in today’s fast-evolving trading landscape.
Understanding Technical Analysis for Modern Markets
Technical analysis is the study of past market data, primarily price and volume, to forecast future price movements. In 2026, with markets characterized by increased algorithmic trading, rapid information dissemination, and a persistent focus on sectors like artificial intelligence and sustainable technologies, the ability to interpret price action through indicators remains highly relevant. These tools offer a quantitative way to assess market sentiment and potential future direction, helping traders develop a structured approach. It is important to remember that technical indicators are not infallible predictive tools but rather instruments for probability assessment and risk management.
Key Technical Indicators for Beginners
Here are seven essential technical indicators that new traders often find valuable:
1. Moving Averages (MA)
What they are: Moving Averages smooth out price data over a specified period, making it easier to identify trends. The two most common types are the Simple Moving Average (SMA), which calculates the average price over a period, and the Exponential Moving Average (EMA), which gives more weight to recent prices.
How to use them:
- Trend identification: When the price is consistently above an MA, it suggests an uptrend; below, a downtrend.
- Support/Resistance: MAs can act as dynamic support (on the way down) or resistance (on the way up) levels.
- Crossovers: A shorter-period MA crossing above a longer-period MA (e.g., 50-day EMA crossing above 200-day EMA, often called a ‘Golden Cross’) can signal a potential bullish trend reversal. The reverse (‘Death Cross’) can signal a bearish reversal.
2. Relative Strength Index (RSI)
What it is: The RSI is a momentum oscillator that measures the speed and change of price movements. It oscillates between 0 and 100.
How to use it:
- Overbought/Oversold conditions: An RSI reading above 70 typically indicates an asset may be overbought and due for a pullback. A reading below 30 suggests it may be oversold and due for a bounce.
- Divergence: If an asset’s price makes a new high but the RSI makes a lower high, it’s bearish divergence, potentially signaling weakening momentum. The reverse is bullish divergence.
3. Moving Average Convergence Divergence (MACD)
What it is: The MACD is a trend-following momentum indicator that shows the relationship between two moving averages of an asset’s price. It consists of the MACD line (difference between a 12-period and 26-period EMA), a signal line (9-period EMA of the MACD line), and a histogram showing the difference between the MACD and signal lines.
How to use it:
- Crossovers: A bullish signal often occurs when the MACD line crosses above the signal line. A bearish signal is when the MACD line crosses below the signal line.
- Centerline crossovers: When the MACD line crosses above the zero line, it can indicate a bullish trend gaining strength. A cross below zero can signal bearish momentum.
- Divergence: Similar to RSI, divergence between price and MACD can signal potential trend reversals.
4. Bollinger Bands
What they are: Bollinger Bands are composed of a simple moving average (typically 20-period) and two standard deviation lines plotted above and below it. They measure market volatility and identify overbought or oversold conditions relative to the average price.
How to use them:
- Volatility: Narrow bands suggest low volatility, potentially preceding a sharp price move. Wide bands indicate high volatility.
- Price Extremes: Prices often tend to revert to the middle band. A touch or break above the upper band may indicate an overbought condition, while a touch or break below the lower band may indicate an oversold condition.
- Squeezes: A period where the bands become very narrow (a ‘squeeze’) can indicate that volatility is about to increase significantly.
5. Stochastic Oscillator
What it is: The Stochastic Oscillator is a momentum indicator comparing a particular closing price of a security to a range of its prices over a certain period. It provides a signal about where the current closing price falls relative to its recent high-low range.
How to use it:
- Overbought/Oversold: Readings above 80 typically indicate overbought conditions, while readings below 20 suggest oversold conditions.
- Crossovers: The %K line (faster) crossing the %D line (slower) can generate buy or sell signals, especially when these occur in overbought or oversold zones.
- Divergence: Similar to RSI and MACD, divergence between price and the Stochastic Oscillator can signal potential reversals.
6. Volume
What it is: Volume represents the total number of shares or contracts traded for a particular asset over a specific period. While not an oscillator, it’s a critical component of technical analysis.
How to use it:
- Confirmation: High volume often confirms the strength of a price move. A strong uptrend on high volume is generally more reliable than one on low volume.
- Reversals: A sudden surge in volume after a prolonged trend, especially if accompanied by a price reversal pattern, can signal a potential end to the current trend. For example, a sharp price drop on exceptionally high volume might indicate capitulation.
- Breakouts: A price breaking above resistance or below support on significantly higher-than-average volume often suggests a valid breakout.
7. Average True Range (ATR)
What it is: The ATR measures market volatility by calculating the average of true ranges over a specified period (typically 14 days). The true range is the greatest of the current high minus the current low, the absolute value of the current high minus the previous close, or the absolute value of the current low minus the previous close.
How to use it:
- Volatility Gauge: Higher ATR values indicate higher volatility, while lower values suggest lower volatility. This can help traders assess the expected price movement range.
- Position Sizing: Some traders use ATR to determine appropriate stop-loss levels and position sizes, allowing for wider stops in volatile markets and tighter stops in less volatile ones.
- Trend Strength: A rising ATR alongside a strong trend indicates increasing conviction and momentum.
Applying Indicators in 2026: Key Considerations
In 2026, market participants continue to grapple with persistent inflation concerns in some regions, evolving monetary policies, and geopolitical shifts that can induce sudden volatility. The increasing interconnectedness of global markets means that events in one part of the world can quickly impact asset prices elsewhere. When utilizing these indicators, it is often beneficial to:
- Combine indicators: Relying on a single indicator can be misleading. Using multiple indicators that confirm each other (e.g., an RSI oversold signal combined with a MACD bullish crossover) can provide stronger signals.
- Consider the timeframe: Indicators behave differently on various timeframes (e.g., hourly, daily, weekly charts). Align your chosen timeframe with your trading strategy.
- Practice risk management: No indicator guarantees success. Always implement proper stop-loss orders and manage your position sizes to protect capital.
- Stay informed: While technical analysis focuses on price action, major news events, economic data, and geopolitical developments can override technical signals.
Understanding and practicing with these fundamental technical indicators can provide a solid foundation for beginner traders navigating the complexities of financial markets in 2026. Remember that consistent learning, discipline, and adaptability are key elements in any trading journey.
Disclaimer: This article is provided for general informational and educational purposes only and does not constitute financial, investment, trading, or legal advice. Gainsium is not a registered investment advisor. Markets are volatile and past performance does not guarantee future results. Readers should conduct their own research and consult a licensed financial advisor before making any investment decisions.