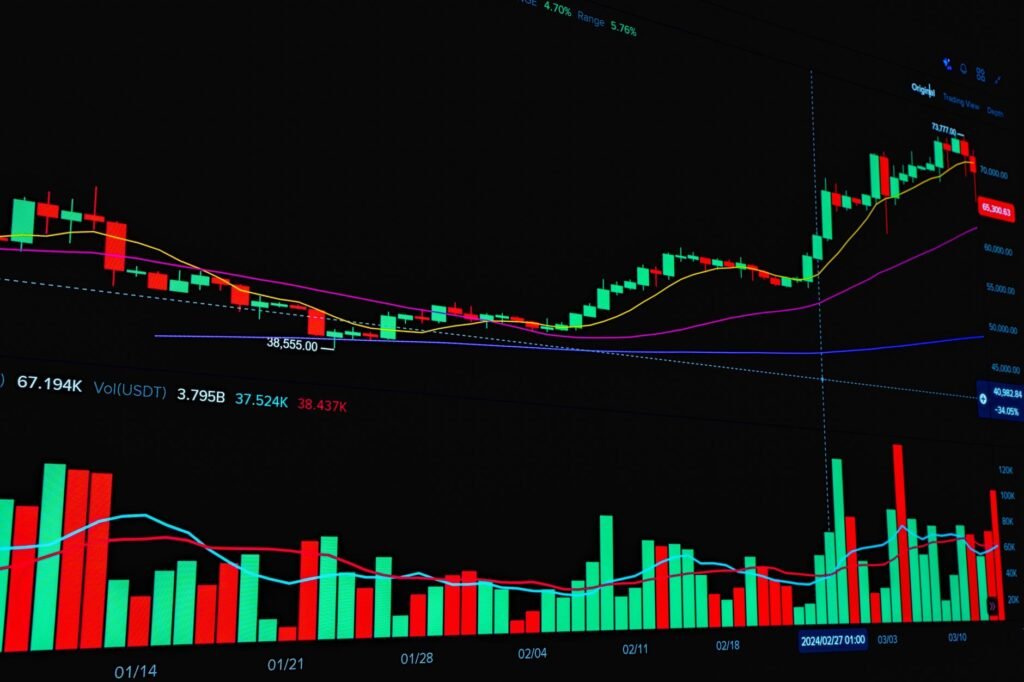

Swing trading, a popular strategy among market participants, involves capturing short to medium-term gains in financial markets. It typically entails holding positions for a few days to several weeks, aiming to profit from price swings within an overarching trend. In 2026’s dynamic market landscape, characterized by evolving interest rate expectations, sector-specific rotations, and continued technological advancements, leveraging the right technical indicators is more crucial than ever for identifying potential entry and exit points.
Understanding Swing Trading and Indicators in 2026
Swing traders seek to capitalize on momentum and trend shifts. Unlike day traders who operate within a single trading day, or long-term investors who hold for months or years, swing traders aim for intermediate price movements. Their success often hinges on their ability to interpret market sentiment and price action using various analytical tools. Technical indicators are mathematical calculations based on a security’s price, volume, or open interest, designed to forecast future price movements. For 2026, where global economic narratives are still unfolding and market volatility can be influenced by macroeconomic data, geopolitical events, and corporate earnings, a robust understanding and application of these indicators are paramount for making informed decisions.
These tools help in identifying trends, measuring momentum, gauging volatility, and pinpointing potential reversal zones. No single indicator provides a complete picture, and effective swing trading often involves combining several indicators to confirm signals and minimize false positives. This approach is particularly relevant in 2026, where market signals can sometimes be conflicting, requiring traders to apply a multi-faceted analytical lens.
7 Essential Technical Indicators for Swing Traders
1. Moving Averages (MA)
Moving Averages are among the most fundamental and widely used technical indicators. They smooth out price data over a specific period, helping to identify the direction of the trend and potential support and resistance levels. The two most common types are the Simple Moving Average (SMA), which gives equal weight to all prices in the period, and the Exponential Moving Average (EMA), which places greater weight on recent prices, making it more responsive to new information. Swing traders often use a combination of short-term (e.g., 10 or 20-period) and longer-term (e.g., 50 or 200-period) MAs. Crossovers of these lines can signal a change in trend, with a shorter MA crossing above a longer MA indicating a bullish signal, and vice-versa for bearish signals. In 2026, with sectors experiencing varying degrees of growth and contraction, MAs remain invaluable for filtering out market noise and confirming underlying trends.
2. Relative Strength Index (RSI)
The Relative Strength Index (RSI) is a momentum oscillator that measures the speed and change of price movements. It oscillates between 0 and 100 and is primarily used to identify overbought or oversold conditions in a security. Traditionally, an RSI reading above 70 suggests the asset is overbought and might be due for a pullback, while a reading below 30 suggests it is oversold and could be poised for a rebound. Swing traders pay close attention to RSI divergences, where the price makes a new high or low, but the RSI does not, potentially signaling a trend reversal. The RSI is crucial for gauging the conviction behind recent price moves, which is especially useful in markets where sharp, emotion-driven reactions can occur, a scenario not uncommon in 2026’s fast-paced digital environment.
3. Moving Average Convergence Divergence (MACD)
The MACD is a trend-following momentum indicator that shows the relationship between two moving averages of a security’s price. It is calculated by subtracting the 26-period EMA from the 12-period EMA. The result is the MACD line. A nine-period EMA of the MACD, called the
Disclaimer: This article is provided for general informational and educational purposes only and does not constitute financial, investment, trading, or legal advice. Gainsium is not a registered investment advisor. Markets are volatile and past performance does not guarantee future results. Readers should conduct their own research and consult a licensed financial advisor before making any investment decisions.