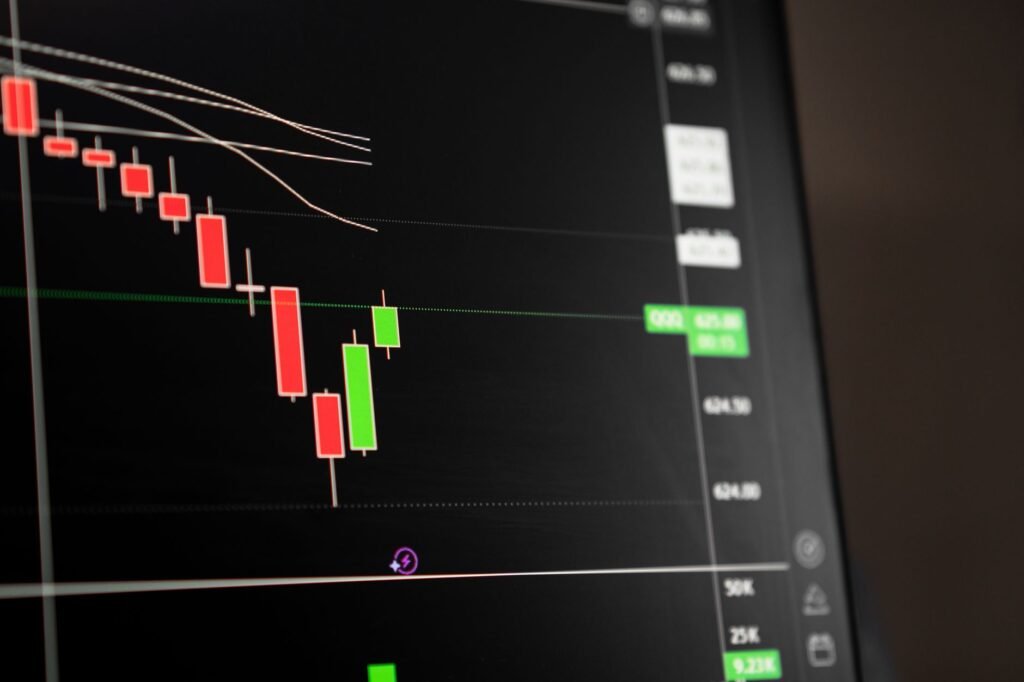

In the dynamic financial markets of 2026, understanding tools for technical analysis remains crucial for market participants. This guide explores how to effectively use Fibonacci retracement levels for trading analysis, helping to identify potential support and resistance zones across various financial instruments. By applying this widely recognized technique, individuals can gain insights into market structure and make more informed decisions.
What Are Fibonacci Retracements?
Fibonacci retracements are horizontal lines that indicate where support and resistance are likely to occur. They are based on Leonardo Fibonacci’s sequence of numbers, where each number is the sum of the two preceding ones (e.g., 0, 1, 1, 2, 3, 5, 8, 13…). The key to Fibonacci retracements lies in the mathematical relationships, or ratios, derived from this sequence.
Key Fibonacci Ratios
- 23.6%
- 38.2%
- 50% (While not a true Fibonacci ratio, it’s widely used and respected by traders as a significant psychological level)
- 61.8% (Often referred to as the ‘golden ratio’)
- 78.6% (The square root of 61.8%)
These ratios represent percentages of a prior move that a price may retrace before continuing in its original direction. For example, if a stock price rises by $10, a 38.2% retracement would mean it falls by $3.82.
Identifying a Valid Price Swing
Before applying Fibonacci retracements, it is essential to correctly identify a significant price swing. This involves locating a clear high and a clear low in the market.
- For an Uptrend: You would typically draw the Fibonacci tool from a significant swing low to a significant swing high.
- For a Downtrend: You would draw the Fibonacci tool from a significant swing high to a significant swing low.
The ‘significance’ of a swing is subjective but generally refers to a prominent peak or trough that marks a clear turning point in the price action on the chosen timeframe. Observing recent market activity in 2026 across various assets, such as major indices or commodities, often reveals identifiable swing structures that can serve as anchors for this analysis.
Plotting Fibonacci Retracements
Most modern charting platforms include a Fibonacci retracement tool. The process generally involves:
- Select the Fibonacci Retracement Tool: Locate it within your charting software’s drawing tools.
- Identify the Swing: Determine the relevant swing low and swing high (or vice-versa for a downtrend).
- Draw the Retracement: Click on the starting point (e.g., swing low in an uptrend) and drag the tool to the ending point (e.g., swing high). The software will then automatically generate horizontal lines at the key Fibonacci levels between these two points.
These lines will represent potential areas where price action might pause, reverse, or consolidate. The levels are considered dynamic; their relevance changes with each new significant price swing.
Interpreting Fibonacci Levels as Support and Resistance
The core utility of Fibonacci retracements lies in their ability to highlight potential support and resistance zones. When a price is correcting an upward move, the Fibonacci levels below the peak may act as support. Conversely, when a price is correcting a downward move, the levels above the trough may act as resistance.
Confluence with Other Indicators
While powerful, Fibonacci retracements are often more effective when used in conjunction with other technical analysis tools. In 2026, market participants frequently combine Fibonacci levels with:
- Trendlines: If a Fibonacci level aligns with a strong trendline, it can amplify the significance of that zone.
- Moving Averages: A Fibonacci retracement level converging with a major moving average (e.g., 50-day or 200-day) can signal a particularly strong support or resistance area.
- Volume Analysis: An increase in trading volume as price approaches a Fibonacci level can suggest strong interest and potential for a reversal or continuation.
- Candlestick Patterns: Reversal candlestick patterns appearing at a Fibonacci level can provide additional confirmation of a turning point.
For instance, if a technology stock, after a significant rally driven by AI advancements earlier in 2026, begins to pull back towards its 38.2% Fibonacci retracement level, and this level also coincides with an upward-sloping 50-day moving average and a historical support zone, it could represent a compelling area where buying interest might emerge.
Integrating Fibonacci with 2026 Market Dynamics
The financial landscape of 2026 continues to be shaped by several broad themes. Persistent inflation concerns, evolving central bank monetary policies, and geopolitical considerations influence market volatility and sentiment. The continued rapid development and adoption of artificial intelligence, alongside shifts in global supply chains, present both opportunities and challenges across various sectors.
In such an environment, Fibonacci retracements can help identify potential entry or exit points within these broader trends. For example, in a robust market rally, market participants might look for pullbacks to the 38.2% or 50% retracement levels as potential opportunities to join the established trend. Conversely, during periods of heightened uncertainty or a developing downtrend, Fibonacci levels could act as resistance points where selling pressure might increase.
It is important to remember that these levels are not guaranteed turning points. Rather, they serve as probabilities and areas of interest. The effectiveness of Fibonacci retracements can vary based on the asset class and prevailing market conditions. Highly liquid and widely traded instruments, such as major forex pairs, large-cap equities, or key commodities, may exhibit more consistent reactions to these levels due to the collective psychology of numerous market participants.
Limitations and Risk Management
While a valuable tool, Fibonacci retracement is not without limitations. It is a predictive tool based on historical price action and market psychology, not a crystal ball. No single indicator can provide absolute certainty in financial markets.
Market participants should always incorporate robust risk management strategies when using Fibonacci retracements. This includes:
- Position Sizing: Determining the appropriate amount of capital to allocate to any given trade.
- Stop-Loss Orders: Placing predetermined levels where a trade will be exited to limit potential losses if the market moves unfavorably.
- Taking Profit Levels: Identifying targets for taking profits once a trade moves in the anticipated direction.
Market conditions can change rapidly, as evidenced by unexpected shifts in economic data or geopolitical events throughout 2026. Therefore, flexibility and continuous re-evaluation of analysis are key. Reliance solely on Fibonacci levels without considering other factors or employing proper risk controls can expose individuals to significant losses. Past performance of any trading strategy or indicator is not indicative of future results.
Conclusion
Fibonacci retracements offer a structured approach to identifying potential support and resistance zones, making them a popular tool for trading analysis in 2026. By understanding how to plot these levels and interpret their significance, market participants can enhance their technical analysis framework. However, their true power is realized when combined with other indicators and disciplined risk management practices. As with any analytical method, continuous learning and adaptation to evolving market conditions are paramount for effective application.
Disclaimer: This article is provided for general informational and educational purposes only and does not constitute financial, investment, trading, or legal advice. Gainsium is not a registered investment advisor. Markets are volatile and past performance does not guarantee future results. Readers should conduct their own research and consult a licensed financial advisor before making any investment decisions.