
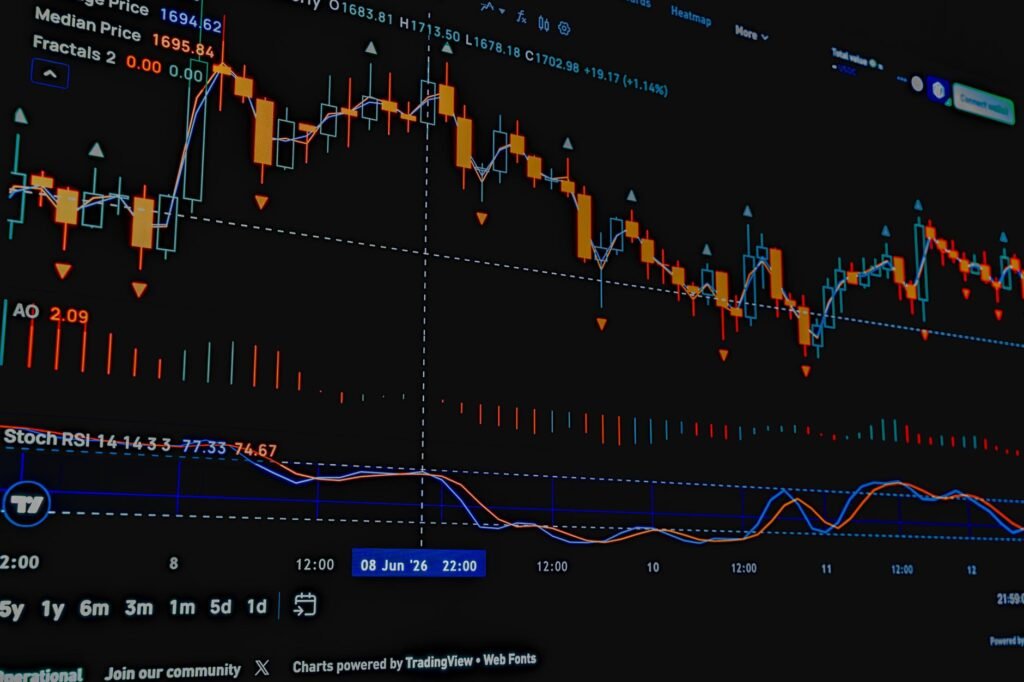

For day traders navigating the dynamic 2026 markets, understanding momentum indicators is paramount. The Relative Strength Index (RSI) stands out as a fundamental tool that can help identify potential momentum shifts and reversals, offering valuable insights for short-term trading decisions. This guide will explore how day traders can effectively integrate RSI into their strategies, leveraging its signals within the context of current market structures and trends to potentially enhance decision-making.
Introduction to RSI in Day Trading
The Relative Strength Index (RSI) is a momentum oscillator developed by J. Welles Wilder Jr. that measures the speed and change of price movements. It oscillates between zero and 100, providing traders with a visual representation of an asset’s recent trading strength. For day traders, RSI is particularly appealing due to its ability to highlight short-term overbought or oversold conditions, which can often precede price reversals or continuations of strong trends.
In the evolving 2026 market landscape, characterized by continued technological integration, dynamic shifts in sectoral leadership, and the ongoing influence of global economic adjustments, identifying these fleeting opportunities is crucial. While artificial intelligence and automation continue to reshape industries, creating rapid momentum in certain equities, broader macro factors may also contribute to volatility. RSI can serve as a robust filter to interpret price action amidst these complex forces, helping to discern genuine shifts from mere market noise over very short timeframes.
Understanding RSI Readings for Day Trading
Overbought and Oversold Zones
The most common application of RSI in day trading involves identifying overbought and oversold conditions. Traditionally, an RSI reading above 70 suggests an asset may be overbought, indicating that its price has risen too quickly and a pullback could be imminent. Conversely, a reading below 30 signals an oversold condition, implying the price may have fallen too rapidly and could be due for a bounce.
For day traders, these thresholds are not absolute buy or sell signals but rather alerts to potential turning points. When an asset’s RSI pushes into overbought territory, it might suggest that the short-term buying pressure is becoming exhausted. Similarly, an oversold RSI could indicate that selling pressure is waning. Day traders often look for other confirmations, such as candlestick patterns or support/resistance levels, before acting on these signals.
Divergence
Divergence between price and RSI can be a powerful signal for day traders, often indicating a strong potential for a reversal. This occurs when the price of an asset moves in one direction while the RSI moves in the opposite direction.
- Bullish Divergence: This occurs when the price makes a new lower low, but the RSI forms a higher low. It suggests that despite the falling price, the selling momentum is weakening, potentially signaling an upcoming bullish reversal.
- Bearish Divergence: This happens when the price makes a new higher high, but the RSI forms a lower high. This indicates that buying momentum is fading even as the price rises, suggesting a potential bearish reversal.
Identifying divergence on short timeframes, such as 5-minute or 15-minute charts, can offer early indications of shifts in market sentiment, allowing day traders to prepare for potential entries or exits.
Centerline Crossovers
While less commonly discussed for day trading than overbought/oversold zones or divergence, the 50-level centerline on the RSI can also provide valuable momentum insights. When RSI crosses above 50, it often indicates increasing bullish momentum, while a cross below 50 suggests increasing bearish momentum. Day traders may use these crossovers as confirmation of a trend’s strength or as a potential trigger for trades in the direction of the momentum, particularly after a period of consolidation or sideways movement.
Advanced RSI Strategies for 2026 Day Trading
Combining RSI with Other Indicators
To enhance the reliability of RSI signals, day traders often combine it with other technical indicators. This layered approach helps confirm signals and reduce false positives, which are particularly prevalent in the fast-paced nature of day trading.
- Volume: Increased volume accompanying an RSI signal (e.g., an oversold RSI turning higher with increasing volume) can add conviction to a potential reversal.
- Support and Resistance Levels: RSI signals occurring near established support or resistance zones tend to be more robust. For instance, an oversold RSI bouncing off a strong support level can be a compelling long entry signal.
- Moving Averages: Using RSI in conjunction with moving averages (e.g., a 20-period or 50-period moving average) can help confirm the prevailing trend. An overbought RSI in an overall uptrend, for example, might be seen as an opportunity for a minor pullback rather than a full reversal.
- Candlestick Patterns: Specific candlestick patterns, such as hammers at oversold lows or shooting stars at overbought highs, can provide precise entry or exit points when combined with RSI signals.
Adapting RSI to Market Volatility in 2026
The 2026 markets continue to present varied volatility across sectors. For instance, high-growth technology stocks or emerging energy solutions might exhibit higher price swings, while more established industrial or consumer staples might be relatively calmer. Day traders may consider adjusting RSI parameters to better suit the volatility of the asset being traded.
A shorter lookback period for RSI (e.g., 7 or 9 instead of the standard 14 periods) can make the indicator more sensitive to rapid price changes, potentially generating more signals but also more noise. Conversely, a longer lookback period can smooth out signals but might delay entries or exits. Some traders also experiment with different overbought/oversold thresholds (e.g., 80/20 for highly volatile assets) to identify more extreme conditions. Proper adaptation is key, and continuous backtesting of adjusted parameters is advisable.
Timeframes for Day Trading
For day trading, RSI is typically applied to short-term charts, such as 1-minute, 5-minute, or 15-minute timeframes. It is common practice to employ a multi-timeframe analysis approach: using a longer timeframe (e.g., 60-minute or daily chart) to establish the overarching trend and then drilling down to shorter timeframes for precise entry and exit signals based on RSI readings. This helps ensure that trades taken on shorter timeframes are aligned with the broader market direction, potentially increasing the probability of success.
Practical Application and Risk Management
Developing a Trading Plan
Effective day trading with RSI, or any indicator, necessitates a well-defined trading plan. This plan should clearly outline your entry criteria (e.g., RSI oversold + bullish divergence + support level), exit criteria (e.g., price hits target, RSI becomes overbought), and, critically, your stop-loss strategy. A robust stop-loss helps manage risk by defining the maximum acceptable loss on any given trade.
Backtesting and Practice
Before deploying any RSI-based strategy with real capital, it is prudent to backtest it extensively using historical data. This process helps evaluate the strategy’s effectiveness and identify potential weaknesses. Furthermore, practicing on a demo or simulated trading account allows you to gain familiarity with the indicator and refine your execution skills without risking actual funds. The potential profitability of any trading strategy is highly variable, depending on market conditions, strategy effectiveness, and individual execution.
The Role of Discipline
Regardless of the sophistication of your RSI strategy, discipline remains paramount in day trading. Emotional decisions, such as chasing trades or holding onto losing positions beyond your predefined stop-loss, can significantly erode capital. Adhering strictly to your trading plan and managing your emotions are critical components for navigating the fast-paced day trading environment successfully.
Ultimately, the Relative Strength Index is a powerful tool for day traders in 2026, offering valuable insights into momentum and potential reversals. However, it is essential to remember that RSI is an indicator, not a crystal ball. Its most effective application often involves combining it with other analytical methods and a strong commitment to risk management and disciplined execution.
Disclaimer: This article is provided for general informational and educational purposes only and does not constitute financial, investment, trading, or legal advice. Gainsium is not a registered investment advisor. Markets are volatile and past performance does not guarantee future results. Readers should conduct their own research and consult a licensed financial advisor before making any investment decisions.