
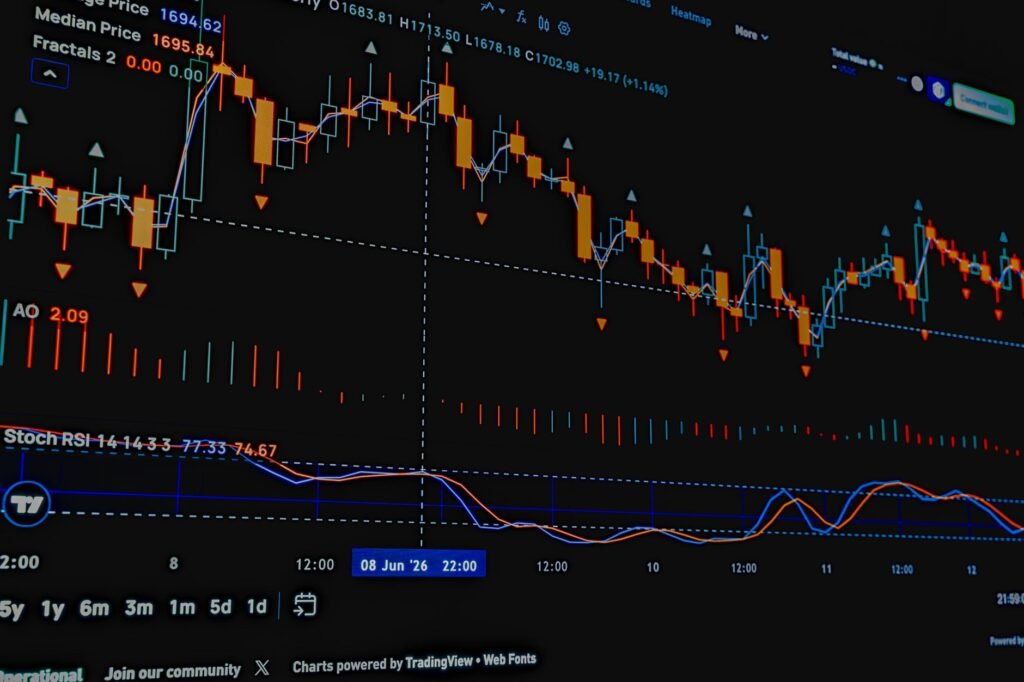

Understanding how to interpret and trade using the Relative Strength Index (RSI) is a fundamental skill for many market participants, even as market dynamics evolve in 2026. This comprehensive guide will illuminate the mechanics of RSI, demonstrate its application in identifying overbought and oversold conditions, and illustrate how to integrate it effectively into diverse trading strategies.
Understanding the Relative Strength Index (RSI)
The Relative Strength Index (RSI) is a momentum oscillator developed by J. Welles Wilder Jr., designed to measure the speed and change of price movements. It oscillates between zero and 100, providing insights into whether an asset’s price is potentially overbought or oversold. As a widely recognized technical indicator, RSI remains a cornerstone for many seeking to gauge market sentiment and potential price reversals.
How RSI Works
At its core, the RSI calculates the ratio of average gains to average losses over a specified period. The most common period for RSI is 14, meaning it considers the price movements over the last 14 candlesticks (days, hours, etc., depending on the chosen timeframe). A higher RSI value indicates that the average gains outweigh average losses, suggesting strong buying pressure, while a lower value implies the opposite.
In the dynamic markets of 2026, where algorithmic trading continues to influence intraday volatility and broad market trends can be swift, understanding the underlying principles of RSI is crucial. Historically, technical indicators like RSI have offered a quantitative method for analyzing market behavior, complementing fundamental analysis in an environment increasingly shaped by both human sentiment and automated systems.
Identifying Overbought and Oversold Conditions
The primary use of RSI is to identify conditions where an asset may be overbought or oversold, signaling potential reversals. These conditions are typically indicated by specific thresholds on the RSI scale.
- Overbought: An RSI reading above 70 suggests that the asset has been bought too aggressively and may be due for a price correction or consolidation. In particularly strong bull markets or during periods of speculative fervor, such as those observed in certain tech or digital asset sectors post-2025, an RSI can remain above 70 for extended periods.
- Oversold: An RSI reading below 30 indicates that the asset has been sold too aggressively and may be due for a bounce or a price increase. Similar to overbought conditions, persistent bearish trends influenced by factors like global economic uncertainty or sector-specific headwinds might see RSI values remain below 30 for prolonged durations.
Some traders adjust these thresholds to 80/20 in highly volatile or trending markets to reduce false signals. It is important to note that an overbought or oversold reading does not automatically guarantee an immediate reversal; rather, it signals an increased probability of one.
Divergence: A Powerful RSI Signal
One of the most potent signals derived from RSI is divergence, which occurs when the price of an asset moves in the opposite direction of the RSI oscillator. Divergence can offer an early warning of a potential trend change:
- Bullish Divergence: Occurs when the asset’s price makes a lower low, but the RSI makes a higher low. This suggests that the selling momentum is weakening, even as the price continues to fall, potentially foreshadowing an upward reversal.
- Bearish Divergence: Occurs when the asset’s price makes a higher high, but the RSI makes a lower high. This indicates that buying momentum is fading, despite the rising price, potentially signaling a downward reversal.
In the complex market environment of 2026, characterized by evolving geopolitical landscapes and shifts in monetary policy globally, recognizing divergence can be particularly valuable. It can help discern when established trends might be losing steam, especially in sectors experiencing significant capital flows or regulatory scrutiny.
Integrating RSI into Trading Strategies
While RSI is a powerful indicator, it is generally most effective when used in conjunction with other technical analysis tools and within a broader understanding of market context. Relying solely on RSI signals can lead to false positives and suboptimal outcomes.
RSI as a Confirmation Tool
Rather than using RSI as a standalone buy/sell signal, many experienced traders employ it as a confirmation tool. For example:
- With Support and Resistance: If an asset’s price approaches a strong support level and the RSI simultaneously moves into oversold territory (e.g., below 30) and then turns upward, it could confirm a potential bounce off support. Conversely, if price nears resistance and RSI hits overbought (e.g., above 70) and turns down, it might confirm a rejection of resistance.
- With Moving Averages: Some strategies involve using RSI to confirm signals generated by moving average crossovers. If a bullish moving average crossover occurs, an RSI moving up from oversold conditions could lend additional conviction to the long signal.
- With Chart Patterns: RSI can help validate breakout or breakdown signals from chart patterns. A breakout from a bullish pattern, accompanied by RSI breaking above 50, could strengthen the signal.
RSI for Trend Following and Mean Reversion
The application of RSI can vary depending on the market regime:
- Trend Following: In strong uptrends, the RSI may often hover above 50, with pullbacks rarely reaching below 40. Traders might look for opportunities to buy on dips when RSI retreats towards the 40-50 area and then turns back up, indicating a continuation of the trend rather than a reversal. Conversely, in downtrends, selling opportunities may arise when RSI rallies towards 50-60 and turns down.
- Mean Reversion: In range-bound markets, where prices tend to revert to an average, RSI can be more directly used for overbought/oversold signals. Buying when RSI is oversold and selling when it’s overbought can be a viable strategy, but it requires careful identification of a truly non-trending market.
Given the nuanced market structure in 2026, which sees a complex interplay between persistent inflation concerns in some regions, potential shifts in central bank policies, and the continuing evolution of digital assets, adapting RSI application to the specific asset and its current trend characteristics is paramount. Understanding these macro factors can significantly improve the efficacy of technical analysis.
Advanced Considerations and Limitations of RSI
While RSI is a versatile tool, it’s not without limitations. Strong trends can cause RSI to remain in overbought or oversold territory for extended periods, leading to premature exit or entry signals if used in isolation. Furthermore, false signals or whipsaws can occur, especially in choppy or low-volume markets.
Effective use of RSI often involves customizing its period settings, though 14 remains the default. Shorter periods make RSI more sensitive, generating more signals but also more false ones, while longer periods make it smoother but less responsive. Experienced participants often conduct backtesting to determine the optimal RSI settings for specific assets and timeframes they trade.
In 2026, the rise of artificial intelligence and machine learning in financial analysis offers new avenues for integrating traditional technical indicators. However, the fundamental principles of RSI, coupled with sound risk management, remain critical. Setting appropriate stop-loss orders and understanding proper position sizing are essential components of any trading strategy, irrespective of the indicators employed. Capital preservation should always be a primary consideration, and no indicator guarantees returns or income amounts. Potential outcomes vary widely based on market conditions, individual strategy, and effort invested.
Disclaimer: This article is provided for general informational and educational purposes only and does not constitute financial, investment, trading, or legal advice. Gainsium is not a registered investment advisor. Markets are volatile and past performance does not guarantee future results. Readers should conduct their own research and consult a licensed financial advisor before making any investment decisions.