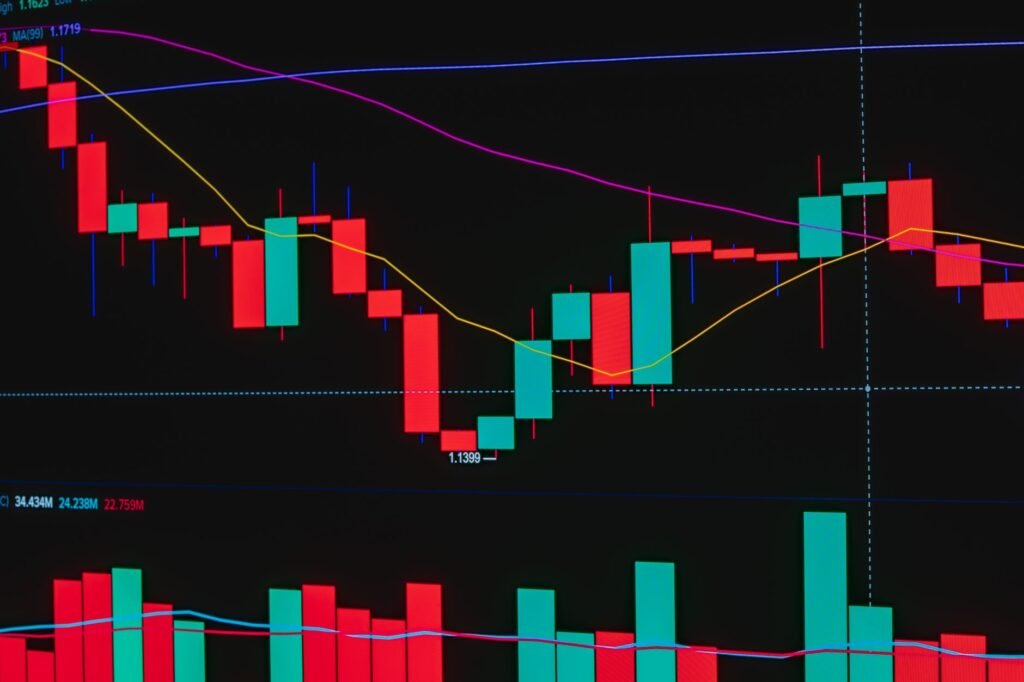

In the dynamic financial markets of 2026, understanding market behavior goes beyond simple price action. While traditional volume indicators show how much was traded over a period, they often miss the critical detail of where that volume occurred. This guide explores how to interpret Volume Profile in trading, explaining what it is, how to read it on charts, and its utility in identifying key support and resistance levels, providing a valuable edge in today’s data-driven trading environment.
Understanding Volume Profile: Beyond Traditional Volume
Volume Profile is an advanced charting tool that displays the total volume traded at specific price levels over a specified period. Unlike traditional volume indicators, which show volume on the X-axis correlating to a time period, Volume Profile presents a horizontal histogram on the Y-axis, aligned with price. This unique perspective reveals areas of high and low trading activity, offering profound insights into market structure and participant behavior.
What is Volume Profile?
At its core, Volume Profile is a graphical representation of market activity, showing the distribution of volume across price levels. Each horizontal bar in the profile indicates the cumulative volume transacted at that particular price level. Traders use this tool to identify significant price zones where market participants showed strong agreement or disagreement on value, making it an indispensable resource for understanding the underlying mechanics of supply and demand.
In 2026, with the pervasive influence of algorithmic trading and high-frequency trading (HFT) strategies, discerning genuine institutional interest from transient algorithmic noise is more crucial than ever. Volume Profile helps filter this noise by highlighting areas of sustained interest, reflecting where significant capital was truly committed.
Key Components of Volume Profile
To effectively interpret Volume Profile, understanding its main components is essential:
- Point of Control (PoC): This is the price level with the highest traded volume for the specified period. The PoC represents the price where the most market participants agreed on value, often acting as a strong magnet for price or a key pivot point.
- Value Area (VA): The Value Area encompasses a specified percentage of the total volume traded (commonly 68-70%) around the PoC. It signifies the price range where the majority of trading activity occurred, indicating where the market perceives ‘fair value.’ Prices trading outside the Value Area suggest either rejection or a potential move towards a new fair value.
- High Volume Nodes (HVN): These are distinct peaks within the Volume Profile, other than the PoC, where significant volume was traded. HVNs indicate price levels where the market spent a considerable amount of time and reached consensus on value, often serving as strong support or resistance zones.
- Low Volume Nodes (LVN): Conversely, LVNs are valleys or areas of minimal volume within the profile. These indicate price levels where little trading occurred, suggesting rapid price movement through these zones. LVNs often act as areas of weak support or resistance, where price might accelerate through or experience sharp reversals.
How to Read and Analyze Volume Profile Charts
Reading Volume Profile charts involves more than just identifying peaks and valleys; it’s about understanding the story the market is telling about value acceptance and rejection. The shape and distribution of the profile provide clues about market sentiment and potential future price action.
Identifying Support and Resistance with Volume Profile
One of Volume Profile’s most powerful applications is in identifying robust support and resistance levels:
- HVNs as Support/Resistance: Prices retesting an HVN often find significant buying or selling interest, causing a reaction. For instance, if price rallies above an HVN and then pulls back, the HVN can act as strong support. Conversely, if price falls below an HVN and then attempts to rally, it can face resistance.
- PoC as a Reversion Level: The PoC frequently acts as an equilibrium point. Price often gravitates towards the PoC, or if it moves away, it may return to retest it. This makes the PoC a key level for identifying potential mean reversion trades or areas where trend continuation might resume after a pullback.
- LVNs and Price Acceleration: LVNs represent areas of inefficiency. When price enters an LVN, it often moves quickly through it until it reaches a High Volume Node or a new area of agreement. Traders may look for momentum plays or quick bounces/falls around these thin areas.
Understanding Market Acceptance and Rejection
The profile’s shape offers a visual representation of market acceptance:
- Bell-Shaped Profile: A well-formed, bell-shaped profile with a prominent PoC and clear Value Area suggests a balanced market, with strong agreement on fair value.
- ‘P’ or ‘b’ Shaped Profiles: These signify trending markets or strong absorption at specific levels. A ‘P’ shape (volume concentrated at the bottom) can indicate short covering or buying pressure pushing prices higher, while a ‘b’ shape (volume concentrated at the top) might suggest long liquidation or selling pressure.
- Elongated Profiles: A longer, flatter profile with multiple HVNs implies a wide range of accepted prices, often seen in volatile or non-trending markets.
Integrating Volume Profile into Your 2026 Trading Strategy
In 2026, where market data is increasingly central to decision-making, Volume Profile offers a sophisticated lens for market analysis. It’s not a standalone magic bullet but a powerful tool that enhances existing strategies when combined with other indicators and a solid understanding of market dynamics.
Confirmation with Other Indicators
Successful traders often use Volume Profile in conjunction with other technical analysis tools. For instance, a Volume Profile-identified HVN acting as resistance can be a more robust signal if it also aligns with a key moving average or a Fibonacci retracement level. Similarly, a breakout above an HVN could be confirmed by increased traditional volume or a bullish MACD cross, enhancing the probability of the trade’s success.
Adapting to Modern Market Structures
The 2026 market landscape is characterized by its reliance on sophisticated algorithms, which execute trades at lightning speed and contribute significantly to overall volume. While this might seem to obscure traditional supply/demand dynamics, Volume Profile remains relevant. Institutional algorithms often target specific liquidity zones or previous areas of high volume, which Volume Profile clearly identifies. By understanding where significant human-driven or persistent algorithmic interest lies, traders can better position themselves amidst the automated flow.
For example, a sustained build-up of volume at a particular price level, forming a strong HVN, even in an algorithm-dominated environment, suggests that major players (human or algorithmic, representing substantial capital) are actively trading there. This provides a clearer picture of key psychological and structural levels that algorithms themselves might respect.
Risk Management and Strategic Placement
Volume Profile offers clear levels for managing risk. Traders can strategically place stop-loss orders just beyond key HVNs or the PoC, as a break of these levels might indicate a shift in market sentiment or value perception. Similarly, take-profit targets can be identified at upcoming HVNs or the opposite side of the Value Area, where price is likely to find resistance or support. Using these clearly defined structural points derived from actual traded volume can lead to more disciplined and potentially more effective trade management.
Understanding how to interpret Volume Profile in trading is a critical skill for navigating the complex financial markets of 2026. By focusing on where volume is transacted, rather than just when, traders gain a deeper appreciation for market structure, identify high-probability support and resistance zones, and develop a more nuanced understanding of market participant behavior. As markets continue to evolve with technological advancements, tools like Volume Profile provide an indispensable framework for making informed trading decisions.
Disclaimer: This article is provided for general informational and educational purposes only and does not constitute financial, investment, trading, or legal advice. Gainsium is not a registered investment advisor. Markets are volatile and past performance does not guarantee future results. Readers should conduct their own research and consult a licensed financial advisor before making any investment decisions.