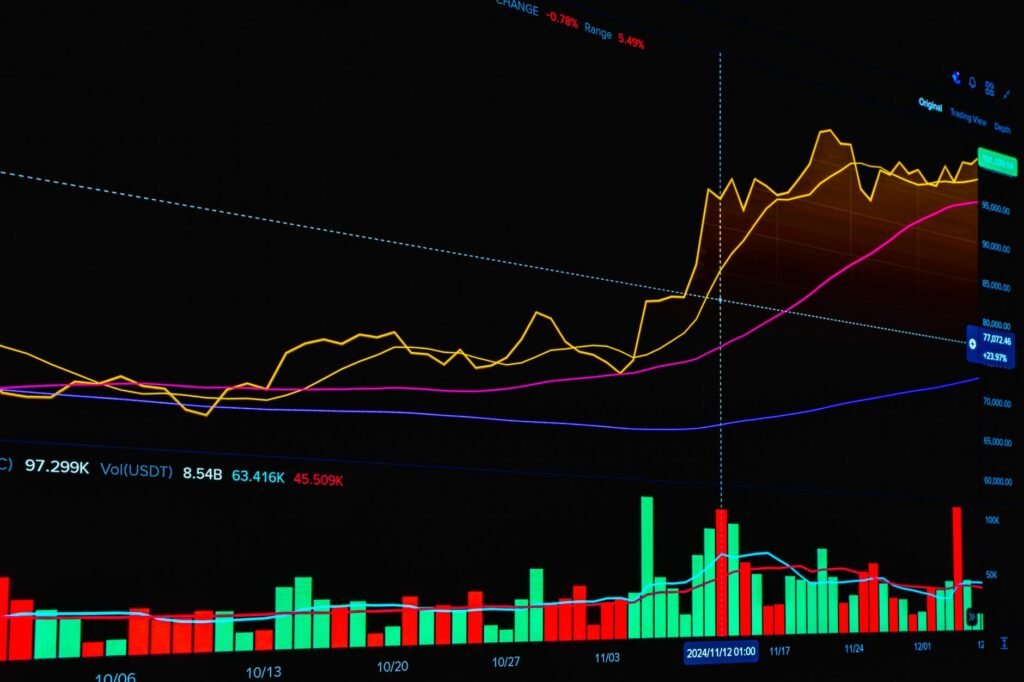

For intraday traders navigating the dynamic markets of 2026, making timely and informed decisions is paramount. Understanding how to interpret market activity, particularly volume, can provide a significant edge. This guide explores how relative volume serves as a critical indicator for identifying high-probability setups, confirming price movements, and enhancing intraday trading strategies.
Relative volume (RVOL) is a powerful metric that quantifies the current trading activity of a security compared to its typical volume for the same time of day. By highlighting unusual levels of interest, RVOL can help traders discern whether price movements are backed by significant market participation, thereby offering insights into potential momentum and the sustainability of a trend.
What is Relative Volume (RVOL)?
Relative Volume, often abbreviated as RVOL, is an indicator designed to compare a stock’s current trading volume to its average historical volume over a specific period, typically for the same time of day. Instead of simply looking at the absolute number of shares traded, RVOL provides context, revealing whether the current trading activity is unusually high or low.
For instance, if a stock typically trades 100,000 shares between 10:00 AM and 10:30 AM, and on a given day it trades 300,000 shares within that same half-hour window, its relative volume would be 3.0. This indicates three times the usual activity, signaling potentially significant market interest or news-driven movement.
In the evolving market landscape of 2026, where algorithmic trading systems and rapid information dissemination are prevalent, identifying deviations from normal trading patterns becomes even more crucial. RVOL helps human traders cut through the noise and focus on instruments experiencing genuine shifts in supply and demand dynamics.
Calculating Relative Volume
Calculating Relative Volume involves a straightforward comparison:
-
Relative Volume (RVOL) = Current Volume / Average Volume for the Same Time Period
Defining ‘Current Volume’
Current Volume refers to the cumulative number of shares traded in the specific timeframe being analyzed. For intraday trading, this might be the volume accumulated over a 5-minute, 15-minute, or 30-minute interval, or the total volume up to the current moment in the trading day.
Determining ‘Average Volume’
The ‘average volume’ component is critical. It typically represents the average volume of the security over the same corresponding period for a look-back window. Common look-back periods include the last 5, 10, or 20 trading days. For example, if evaluating RVOL at 11:00 AM, the average volume would be the average of all past 11:00 AM volumes over the chosen historical period.
Many advanced charting platforms and trading software in 2026 provide RVOL as a built-in indicator, automatically performing these calculations and displaying the value in real-time. This automation allows traders to integrate RVOL seamlessly into their decision-making process without manual calculation.
Why Relative Volume Matters for Intraday Traders in 2026
The year 2026 sees continued evolution in market structure, characterized by heightened data integration, increasingly sophisticated retail trading tools, and persistent influence from global macroeconomic factors. In this environment, RVOL remains a vital indicator for several reasons:
-
Identifying Institutional Interest: Unusually high relative volume often indicates the presence of institutional players, hedge funds, or large individual traders. These entities can move markets, and their participation frequently precedes significant price shifts.
-
Validating Price Action: A strong price move accompanied by high relative volume suggests conviction behind the move. Conversely, a price spike on low relative volume might be more susceptible to reversal.
-
Early Signal Detection: RVOL can alert traders to stocks that are ‘in play’ early in the trading session, allowing for timely entry or increased vigilance on potential setups. This is especially relevant in a fast-paced market where opportunities can materialize and fade quickly.
-
Enhanced Filtering: With the vast number of tradable securities, RVOL acts as an effective filter. Traders can scan for stocks exhibiting high RVOL to narrow down their focus to those with the most active interest and potential for intraday movement.
Practical Applications of Relative Volume in Intraday Trading
RVOL is rarely used in isolation. Its true power emerges when combined with price action, chart patterns, and other technical indicators. Here are practical ways traders leverage RVOL for intraday decisions:
1. Confirming Breakouts and Breakdowns
When a stock breaks above a resistance level or below a support level, observing the relative volume is crucial. A breakout with significantly high RVOL (e.g., 2.0 or higher) suggests strong buying pressure and conviction, increasing the probability that the breakout will sustain. Conversely, a breakout on below-average or merely average RVOL might be a ‘fakeout’ or a weak move likely to reverse.
2. Spotting Potential Reversals
An exhaustion move, where a strong trend suddenly sees an explosion in volume without a corresponding significant price change, can signal a potential reversal. High RVOL at key inflection points, such as major support/resistance or the top/bottom of a trend, might indicate a battle between buyers and sellers, often preceding a shift in momentum.
3. Filtering Daily Watchlists
Many intraday traders begin their day with a watchlist. Incorporating RVOL into pre-market scans helps to prioritize stocks already showing significant interest before the market opens or shortly after. A stock with a high pre-market RVOL often carries that momentum into the regular trading session, presenting more liquidity and potential volatility.
4. Identifying News-Driven Momentum
Corporate announcements, economic data releases, or sector-specific news frequently cause spikes in trading volume. High RVOL confirms that market participants are reacting to this information. Traders often look for RVOL spikes concurrent with a news catalyst to capitalize on momentum plays, understanding that the increased liquidity can provide cleaner entries and exits.
5. Complementing Price Action and Chart Patterns
RVOL adds a layer of confirmation to traditional technical analysis. For example, a bullish flag pattern forming with diminishing volume (lower RVOL) within the flag, followed by a breakout on high RVOL, provides a stronger signal than a breakout without volume confirmation. Similarly, a head-and-shoulders pattern validated by declining RVOL on the second shoulder’s ascent can strengthen the bearish implication.
Interpreting Relative Volume Values
-
RVOL = 1.0: The current volume is exactly average for that specific time of day.
-
RVOL > 1.0: Volume is above average. The higher the number (e.g., 2.0, 3.0, or even 5.0+), the more significant the deviation from normal activity, implying increased interest or a major event.
-
RVOL < 1.0: Volume is below average. This often suggests a lack of interest, consolidation, or a period of indecision in the market.
Experienced traders often look for RVOL readings above 2.0 or 3.0 to consider a stock truly
Disclaimer: This article is provided for general informational and educational purposes only and does not constitute financial, investment, trading, or legal advice. Gainsium is not a registered investment advisor. Markets are volatile and past performance does not guarantee future results. Readers should conduct their own research and consult a licensed financial advisor before making any investment decisions.