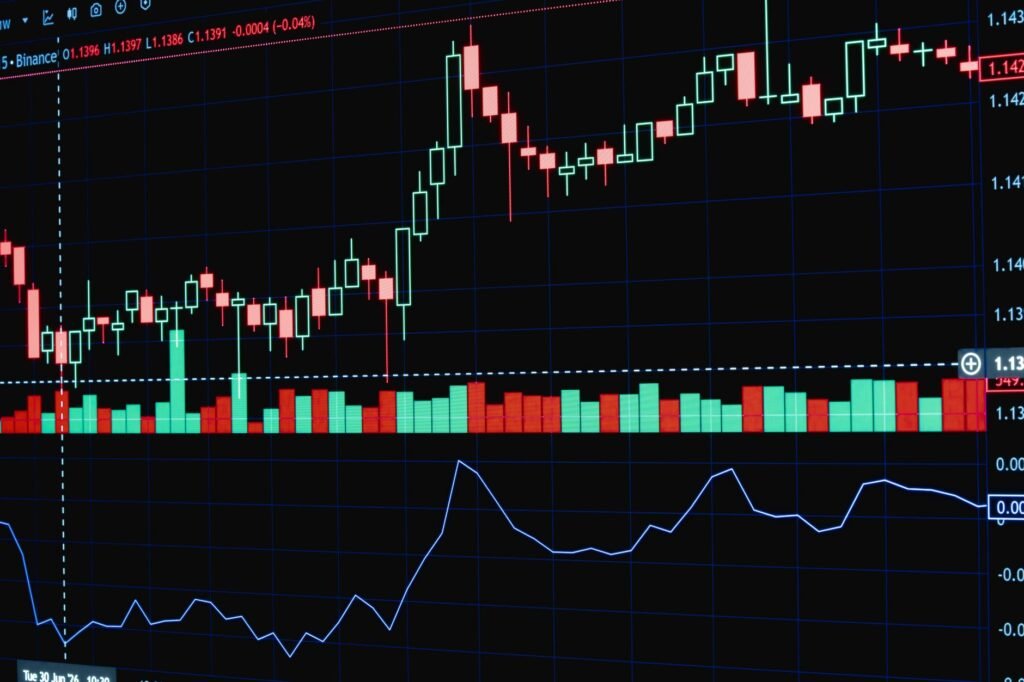

Understanding market volatility is a crucial skill for any trader, and the Average True Range (ATR) is a powerful tool designed to quantify it. This article will explain how the Average True Range (ATR) indicator measures market volatility and how traders can effectively use it to inform their stop-loss placements and position sizing strategies, adapting to ever-changing market conditions.
Understanding Average True Range (ATR)
The Average True Range (ATR) is an indicator developed by J. Welles Wilder Jr. in his book New Concepts in Technical Trading Systems. Unlike indicators that attempt to predict price direction, ATR focuses solely on measuring the degree of price volatility over a specified period. It provides a smoothed average of the true range over a selected number of periods, typically 14.
Calculating True Range
Before ATR can be calculated, the ‘True Range’ for each period must first be determined. The True Range (TR) is the greatest of the following three values:
- Current High minus Current Low: This measures the range within the current trading period.
- Absolute value of Current High minus Previous Close: This accounts for gaps up, where the current high is significantly above the previous close.
- Absolute value of Current Low minus Previous Close: This accounts for gaps down, where the current low is significantly below the previous close.
By taking the maximum of these three values, the True Range effectively captures all price movement, including opening gaps, ensuring a comprehensive measure of a period’s volatility.
The ATR Calculation
Once the True Range is calculated for several periods, the ATR is simply the moving average of these True Range values. A common setting for ATR is 14 periods, meaning it averages the True Ranges of the last 14 bars (whether daily, hourly, or minute bars). This smoothing process provides a more stable measure of volatility, filtering out short-term spikes. A higher ATR value indicates greater market volatility, meaning prices are moving in larger ranges, while a lower ATR value suggests lower volatility and narrower price ranges.
The Role of Volatility in Trading
Volatility is an inherent characteristic of financial markets, constantly fluctuating in response to a myriad of factors. In 2026, as in previous years, market volatility continues to be influenced by global macroeconomic policies, technological advancements, geopolitical developments, and shifting investor sentiment. For instance, central bank interest rate decisions, reports on inflation and employment, and innovation in sectors like AI or sustainable energy can all contribute to periods of increased or decreased market choppiness.
Understanding and measuring this volatility is paramount because it directly impacts a trader’s risk exposure and potential for profit. Trading strategies that might be effective in low-volatility environments could prove disastrous in high-volatility periods, and vice-versa. ATR helps traders quantify this crucial element, allowing for more adaptive and robust trading decisions rather than relying on static assumptions.
Practical Applications of ATR in Trading
ATR’s strength lies in its practical utility for risk management. Its dynamic nature makes it an invaluable tool for adapting strategies to current market conditions.
Setting Dynamic Stop-Loss Levels
One of the most common and effective uses of ATR is in setting dynamic stop-loss orders. A fixed dollar or percentage stop-loss might be too tight in a volatile market, leading to premature exits (known as being
Disclaimer: This article is provided for general informational and educational purposes only and does not constitute financial, investment, trading, or legal advice. Gainsium is not a registered investment advisor. Markets are volatile and past performance does not guarantee future results. Readers should conduct their own research and consult a licensed financial advisor before making any investment decisions.