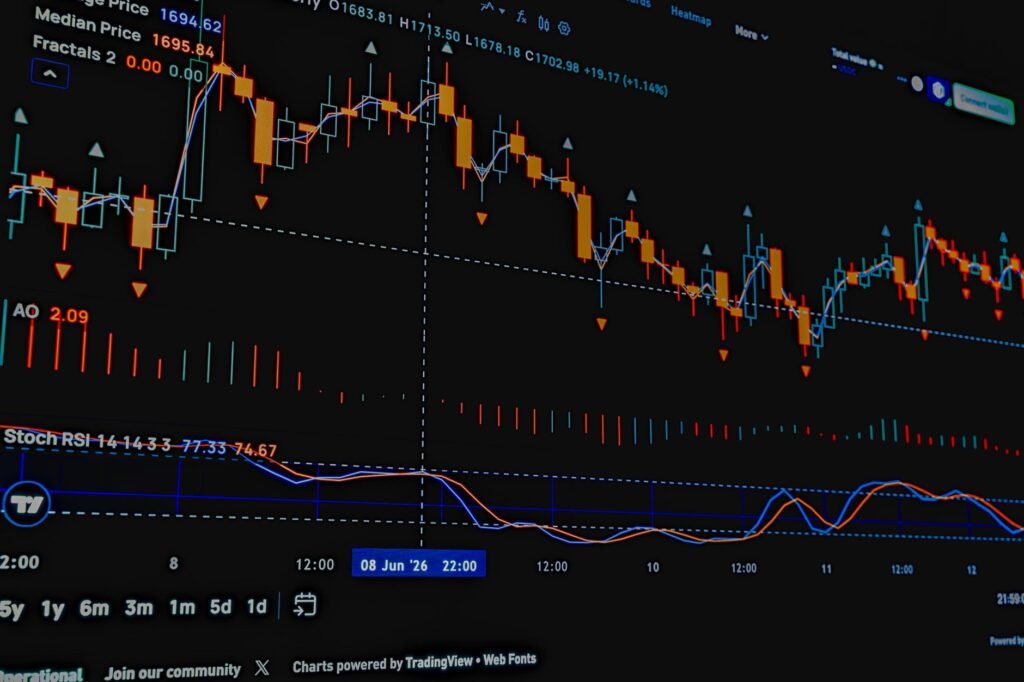

In the dynamic world of technical trading, understanding and applying various indicators can provide valuable insights into market momentum. This beginner’s guide will explore the Relative Strength Index (RSI), a popular momentum oscillator, explaining what it is, how to interpret its signals, and practical ways to integrate it into your technical trading strategies. Developed by J. Welles Wilder Jr., the RSI helps traders identify overbought or oversold conditions in an asset, offering potential clues about future price movements.
What is the Relative Strength Index (RSI)?
The Relative Strength Index (RSI) is a momentum oscillator that measures the speed and change of price movements. It oscillates between zero and 100, providing a visual representation of an asset’s price strength. The most common period used for calculating the RSI is 14 periods, which can refer to 14 days, 14 hours, or any other timeframe depending on the chart being analyzed.
Essentially, the RSI quantifies the average gain versus the average loss over a specified period. A higher RSI value indicates that the average gains are outperforming the average losses, suggesting strong buying pressure. Conversely, a lower RSI value suggests that average losses are exceeding average gains, indicating selling pressure.
Interpreting RSI Signals
Understanding how to read RSI signals is crucial for its effective application in trading. While the indicator itself is relatively straightforward, its interpretation requires nuance and consideration of market context.
Overbought and Oversold Levels
The most fundamental interpretation of the RSI involves its overbought and oversold levels. Traditionally:
- An RSI reading above 70 suggests that an asset may be overbought. This means the price has risen too quickly and may be due for a pullback or correction.
- An RSI reading below 30 suggests that an asset may be oversold. This indicates the price has fallen too quickly and could be poised for a bounce or reversal.
It is important to note that an asset can remain in overbought or oversold territory for extended periods during strong trends. Therefore, these signals are often best used in conjunction with other indicators or price action analysis.
Divergence
Divergence occurs when the RSI and the price action of an asset move in opposite directions, often signaling a potential trend reversal. There are two primary types:
- Bullish Divergence: This occurs when the asset’s price makes a lower low, but the RSI makes a higher low. This can indicate that the selling momentum is weakening, and a price reversal to the upside might be imminent.
- Bearish Divergence: This happens when the asset’s price makes a higher high, but the RSI makes a lower high. This suggests that the buying momentum is fading, and a price reversal to the downside could be approaching.
Divergences are generally considered stronger signals when they occur at extreme RSI levels (e.g., near 70 or 30).
Centerline Crossovers
The 50-level on the RSI often acts as a centerline. A move above 50 generally indicates that average gains are greater than average losses, suggesting an upward trend in momentum. Conversely, a move below 50 suggests that average losses are greater than average gains, indicating downward momentum. While less commonly used as a primary signal, a sustained move above or below 50 can confirm a trend’s direction.
Integrating RSI into Technical Trading Strategies
While the RSI offers valuable insights, it is rarely used in isolation. Successful technical traders often combine it with other tools to confirm signals and increase the probability of successful trades. The year 2026 continues to see a strong emphasis on multi-indicator approaches, given ongoing market volatility and the wealth of data-driven insights available.
RSI with Support and Resistance
Combining RSI with identified support and resistance levels can enhance signal reliability. For instance, if an asset’s price is approaching a significant support level while its RSI simultaneously dips into oversold territory (below 30), this confluence of factors could present a stronger potential buying opportunity for a bounce.
RSI with Trend Lines
Drawing trend lines on the price chart and the RSI chart can offer additional confirmation. If an asset is in an uptrend, a pullback to the trend line accompanied by the RSI nearing oversold conditions can signal a potential continuation of the uptrend. Similarly, a breakdown of a trend line in price action, confirmed by the RSI breaking below its own support level, might suggest further downside.
RSI with Other Indicators (e.g., Moving Averages)
Pairing RSI with trend-following indicators like Moving Averages (MAs) is a common strategy. For example, some traders might look for buying opportunities when the price is above its 50-period moving average (indicating an uptrend) and the RSI pulls back to an oversold level before turning up. This acts as a ‘buy the dip’ strategy within an established trend.
Practical Considerations for RSI Users
As with any technical indicator, the RSI is a tool that requires practice and contextual understanding. The current market environment of 2026, characterized by increasing reliance on data analytics and the integration of AI-powered trading tools, only underscores the importance of a comprehensive approach to analysis. Traders are increasingly looking for robust strategies that can adapt to rapid market shifts.
When using RSI, consider the following:
- No Indicator is Perfect: The RSI can sometimes give false signals, especially in choppy or sideways markets. It should not be the sole basis for trading decisions.
- Timeframe Matters: The RSI’s behavior can vary significantly across different timeframes. A daily RSI reading might suggest an asset is overbought, while a weekly RSI might still show room for growth. Always align the RSI’s timeframe with your trading strategy.
- Market Context is Key: Strong trends can keep the RSI in overbought or oversold territory for extended periods. In such cases, relying solely on extreme RSI readings for reversals can lead to premature exits or entries. Instead, use RSI to identify potential exhaustion points within the context of the larger trend.
- Customize Settings: While 14 is the standard period, some traders experiment with different settings (e.g., 9 for more sensitivity, 21 for less sensitivity) to better suit specific assets or trading styles.
Mastering the Relative Strength Index involves more than just identifying overbought or oversold conditions. It requires combining its signals with broader market analysis, understanding price action, and confirming insights with other technical tools. By integrating the RSI thoughtfully into your technical trading framework, you can gain a deeper understanding of market momentum and potentially enhance your decision-making process.
Disclaimer: This article is provided for general informational and educational purposes only and does not constitute financial, investment, trading, or legal advice. Gainsium is not a registered investment advisor. Markets are volatile and past performance does not guarantee future results. Readers should conduct their own research and consult a licensed financial advisor before making any investment decisions.