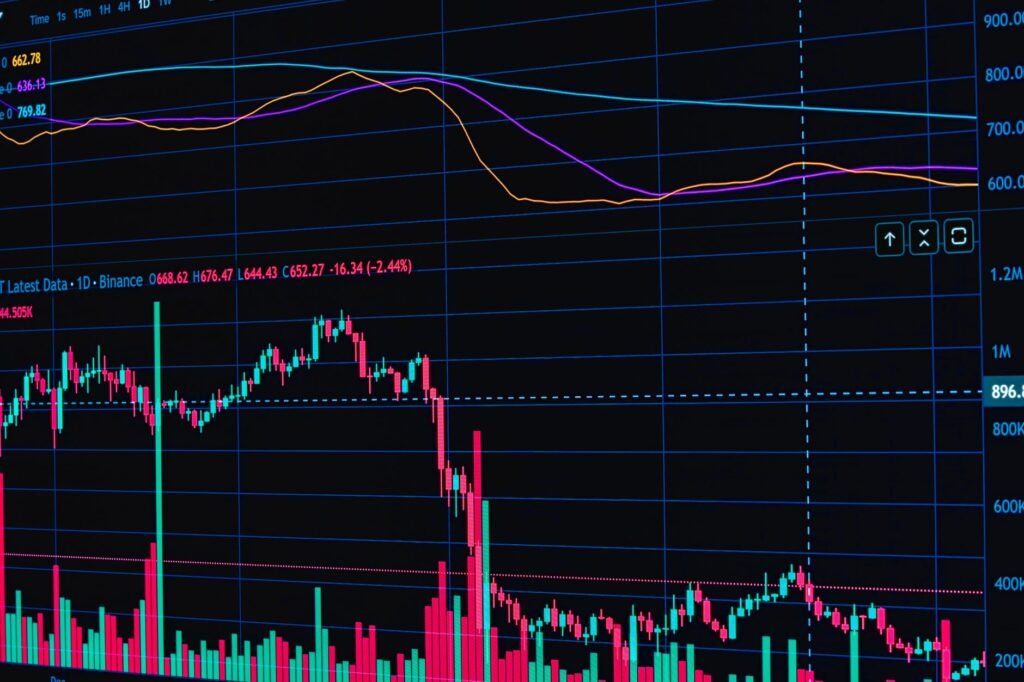

Understanding how to identify potential support and resistance levels is crucial for many traders. Fibonacci retracements offer a powerful technical analysis tool to help pinpoint these key price zones, which can be invaluable for making more informed trading decisions in 2026’s dynamic markets. This guide provides a beginner-friendly overview of how to effectively apply and interpret Fibonacci retracement levels.
What Are Fibonacci Retracements?
Fibonacci retracements are a technical analysis tool based on the Fibonacci sequence, a series of numbers where each number is the sum of the two preceding ones (e.g., 0, 1, 1, 2, 3, 5, 8, 13…). The ratios derived from this sequence, particularly the Golden Ratio (approximately 1.618), are observed frequently in nature and, according to proponents, in financial market movements.
Traders apply these ratios as percentages to a chart, typically between a significant swing high and a swing low, to identify potential areas where prices might retrace or pull back before continuing their overarching trend. These levels are viewed as areas of potential interest where market participants might enter or exit positions.
Key Fibonacci Retracement Levels
While the Fibonacci sequence provides numerous ratios, several specific percentages are most commonly used in technical analysis. These levels are derived from the relationships between numbers in the sequence:
- 23.6%
- 38.2% (1/1.618 ≈ 0.618; 1 – 0.618 = 0.382)
- 50% (Not a Fibonacci ratio itself, but widely recognized as a psychological level of support or resistance)
- 61.8% (The Golden Ratio’s reciprocal, 1/1.618)
- 78.6% (The square root of 61.8% is approximately 78.6%)
These percentages represent potential areas where a price correction or retracement might pause or reverse. When a stock, commodity, or digital asset price is moving in a strong trend, it often retraces a portion of that move before continuing in the original direction. These retracement levels aim to forecast where those pauses might occur.
How to Draw Fibonacci Retracements
Applying Fibonacci retracements to a price chart involves a straightforward process. Most modern trading platforms offer a built-in Fibonacci retracement tool.
Identifying Swing Highs and Swing Lows
The first step is to identify a clear, significant price movement, often called a
Disclaimer: This article is provided for general informational and educational purposes only and does not constitute financial, investment, trading, or legal advice. Gainsium is not a registered investment advisor. Markets are volatile and past performance does not guarantee future results. Readers should conduct their own research and consult a licensed financial advisor before making any investment decisions.