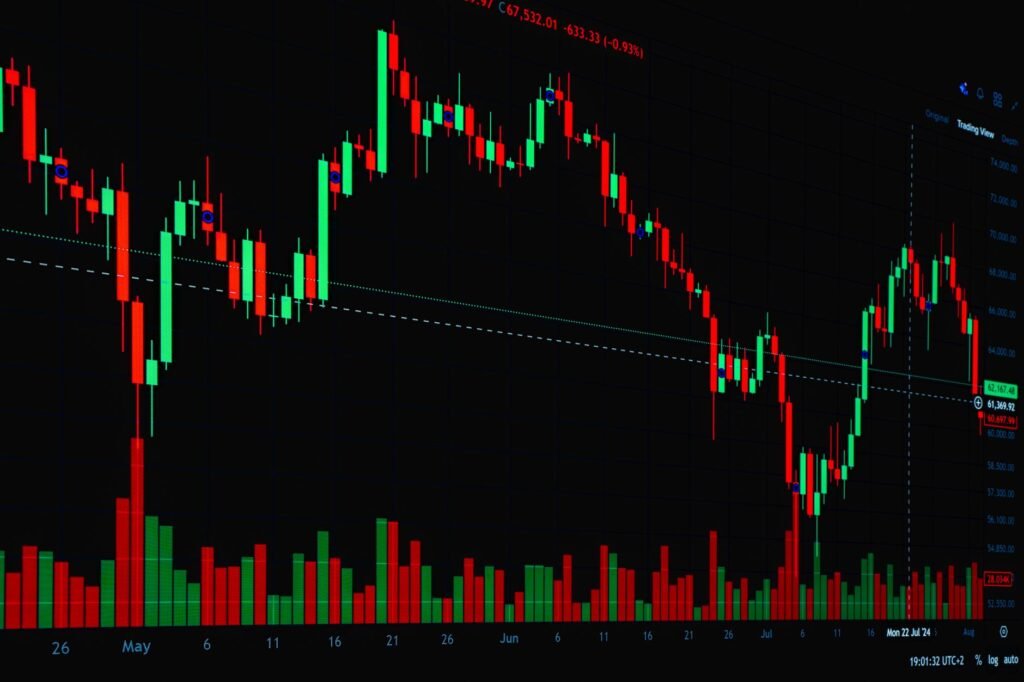

Understanding market movements can often feel like deciphering a complex code, but technical analysis offers various tools to help chartists identify potential turning points. Among these, Fibonacci retracements stand out as a popular method. This guide will walk through how to use Fibonacci retracements in technical analysis, providing a step-by-step approach for beginners to understand and apply these levels to identify potential support and resistance zones in price charts.
What are Fibonacci Retracements?
Fibonacci retracements are a technical analysis tool based on the Fibonacci sequence, a series of numbers where each number is the sum of the two preceding ones (e.g., 0, 1, 1, 2, 3, 5, 8, 13, 21, etc.). While the sequence itself appears in nature and various mathematical contexts, its application in financial markets derives from the ratios generated when dividing numbers within the sequence.
Key Fibonacci retracement levels, expressed as percentages, are derived from these mathematical relationships:
- 23.6%
- 38.2%
- 50% (While not a true Fibonacci ratio, the 50% level is widely observed by traders for psychological reasons and often included.)
- 61.8% (Known as the “golden ratio”)
- 78.6% (The square root of 61.8%)
These percentages are believed to indicate areas where a price movement, after a significant trend, might pause or reverse before continuing its original direction. For example, if a stock price rises significantly, it might retrace downwards to one of these Fibonacci levels before resuming its upward climb. Similarly, after a fall, it might bounce back up to a retracement level before falling further.
Why are Fibonacci Levels Significant?
The significance of Fibonacci levels in trading is often debated, with some attributing their effectiveness to self-fulfilling prophecy – meaning, enough traders use them that they become effective. Others suggest they reflect natural market psychology and herd behavior. Regardless of the underlying reason, these levels are widely watched as potential zones for price reversals or consolidations. In the dynamic markets of 2026, where digital assets continue to mature and traditional markets face evolving geopolitical and economic influences, tools that help identify potential market structure become even more relevant for many participants seeking to understand market flows.
Applying Fibonacci Retracements: A Step-by-Step Guide
Using the Fibonacci retracement tool on a charting platform typically involves a few straightforward steps.
-
Identify a Clear Price Swing
The first step is to locate a distinct high and a distinct low point that define a significant price move. This could be an impulse wave up or down. For an uptrend, you will identify a major low (swing low) and the subsequent major high (swing high). For a downtrend, you will identify a major high (swing high) and the subsequent major low (swing low). It is crucial that these points represent a significant, observable move on your chosen timeframe.
-
Draw the Fibonacci Retracement Tool
Once you’ve identified your swing points, select the Fibonacci retracement tool on your charting software. The way you draw it depends on the direction of the initial move:
- For an uptrend (to find potential support during a pullback): Click and drag the tool from the swing low to the swing high. The tool will then draw horizontal lines at the Fibonacci percentage levels between these two points.
- For a downtrend (to find potential resistance during a bounce): Click and drag the tool from the swing high to the swing low. The tool will draw horizontal lines at the Fibonacci percentage levels between these two points.
-
Interpret the Retracement Levels
After drawing the lines, you will see horizontal lines at the 23.6%, 38.2%, 50%, 61.8%, and 78.6% levels. These lines represent potential areas where price might find:
- Support if the price is pulling back from an uptrend.
- Resistance if the price is bouncing up from a downtrend.
The 38.2%, 50%, and 61.8% levels are often considered the most significant retracement zones by many traders, but all levels can potentially influence price action.
-
Combine with Other Technical Analysis Tools
Fibonacci retracements are most effective when used in conjunction with other technical analysis indicators and patterns. For instance, in 2026, with markets exhibiting periods of heightened volatility driven by global economic policy shifts and rapid technological advancements in sectors like AI and renewable energy, traders often look for confluence. This means looking for a Fibonacci level that also aligns with:
- A previous support or resistance level.
- A trendline.
- A moving average.
- A candlestick reversal pattern.
- Volume spikes indicating increased interest.
A strong signal is often seen when multiple indicators converge at or near a Fibonacci level. For example, if a stock pulls back to the 61.8% Fibonacci level and simultaneously bounces off a long-term moving average with increased buying volume, it could be interpreted as a stronger potential support zone.
Important Considerations and Limitations
While Fibonacci retracements are a valuable tool, it’s crucial to understand their limitations:
- Subjectivity: Identifying the “correct” swing high and swing low can sometimes be subjective, especially for beginners. Different traders might choose different points, leading to varied retracement levels.
- Not a Guarantee: Fibonacci levels do not guarantee that price will reverse or hold at a specific level. They merely identify potential areas of interest. Price can often move through these levels without stopping.
- Context is Key: The effectiveness of Fibonacci retracements often depends on the overall market context. In 2026, for example, periods of high uncertainty or significant news events can override technical patterns, emphasizing the need for a comprehensive market view.
- One Tool Among Many: No single technical indicator should be used in isolation. Successful technical analysis often involves combining multiple tools and strategies to build a more robust perspective on market probabilities.
Using Fibonacci retracements in technical analysis can offer a structured way to identify potential support and resistance levels. By following a clear step-by-step process and always combining this tool with other forms of analysis, individuals can enhance their understanding of market dynamics and potential turning points. As always, remember that market participation carries inherent risks, and past patterns do not guarantee future results.
Disclaimer: This article is provided for general informational and educational purposes only and does not constitute financial, investment, trading, or legal advice. Gainsium is not a registered investment advisor. Markets are volatile and past performance does not guarantee future results. Readers should conduct their own research and consult a licensed financial advisor before making any investment decisions.