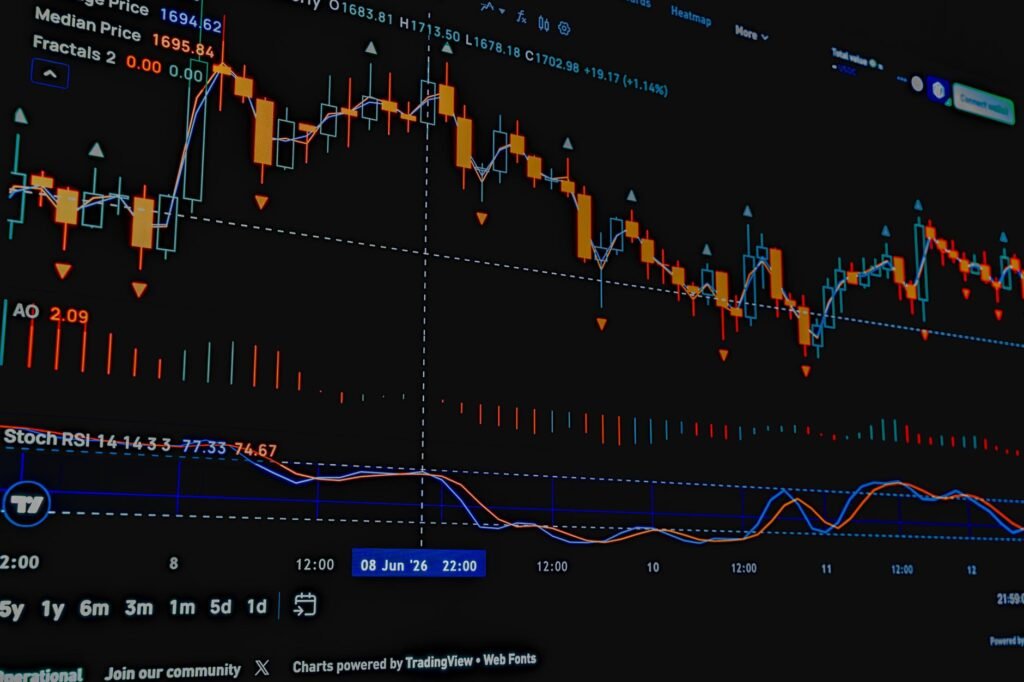

The Relative Strength Index (RSI) is a momentum oscillator used by traders to measure the speed and change of price movements. Understanding how to effectively use the RSI in trading strategies can provide valuable insights into market conditions, helping to identify potential overbought or oversold situations and possible trend reversals. This guide explores the mechanics of RSI, its interpretation, and practical applications within various trading approaches.
Understanding the Relative Strength Index (RSI)
Developed by J. Welles Wilder Jr. and introduced in his 1978 book, “New Concepts in Technical Trading Systems,” the Relative Strength Index (RSI) is a cornerstone in the world of technical analysis. It is a momentum oscillator that measures the velocity and magnitude of directional price movements. Traders often employ RSI to assess whether a security is overbought or oversold, providing potential signals for trend reversals or continuations. Unlike some indicators that focus solely on price action, RSI considers both the bullish and bearish price momentum over a specified period, typically 14 periods (e.g., 14 days, 14 hours).
The RSI is displayed as an oscillator, meaning it moves between two extremes, typically 0 and 100. This bounded range makes it particularly useful for identifying potential turning points in asset prices. A high RSI reading suggests that an asset has been experiencing strong upward momentum, potentially indicating it is overbought, while a low reading suggests strong downward momentum, indicating it is potentially oversold. RSI quantifies the strength of recent price changes, offering a clearer perspective beyond simple visual inspection.
Calculating and Interpreting RSI
While modern trading platforms automate the calculation of RSI, understanding its underlying mechanics can deepen a trader’s appreciation for its signals. The core formula involves two steps:
- First Calculation of RSI:
RSI = 100 – [100 / (1 + Average Gain / Average Loss)]
Where:- Average Gain is the average of upward price changes over the chosen period.
- Average Loss is the average of downward price changes over the chosen period (expressed as a positive value).
- Subsequent Calculations (Wilder’s Smoothing):
After the initial calculation, Wilder refined the method by using a smoothed average, similar to an exponential moving average, for subsequent periods. This smoothing helps to reduce choppiness and provide a more reactive indicator.
The standard period for RSI is 14, though traders can adjust this parameter for more or less sensitivity to price changes, depending on their trading style and asset volatility.
Key Interpretation Levels
- Overbought and Oversold Zones: The most common interpretation of RSI involves its thresholds.
- An RSI reading above 70 generally suggests that the asset is becoming overbought. This indicates that prices have risen rapidly and may be due for a correction or consolidation.
- An RSI reading below 30 generally suggests that the asset is becoming oversold. This implies that prices have fallen significantly and may be due for a rebound.
Some traders adapt these levels, using more aggressive 80/20 or conservative 60/40 thresholds based on an asset’s typical volatility.
- Centerline Crossover (50): The 50-level often acts as a centerline. A move above 50 can indicate increasing bullish momentum, while a move below 50 suggests increasing bearish momentum. This can be used to confirm the prevailing trend or to identify shifts in momentum.
- RSI Divergence: This is a powerful signal that occurs when the price of an asset moves in one direction while the RSI moves in the opposite direction.
- Bearish Divergence: When the asset price makes a higher high, but the RSI makes a lower high. This can signal weakening momentum and a potential bearish reversal.
- Bullish Divergence: When the asset price makes a lower low, but the RSI makes a higher low. This can signal strengthening momentum and a potential bullish reversal.
Divergences are often considered stronger signals when they occur at extreme RSI levels (e.g., above 70 or below 30).
- Failure Swings: These are similar to divergences and involve the RSI failing to confirm new highs or lows made by the price, suggesting a potential trend reversal.
Integrating RSI into Trading Strategies
While RSI can provide valuable signals, it is generally most effective when combined with other technical indicators and analytical tools. Relying solely on a single indicator can lead to false signals, especially in trending markets where an asset can remain overbought or oversold for extended periods.
Common RSI-Based Strategies
- RSI and Trend Confirmation:
In a strong uptrend, an asset might remain above the 70 overbought threshold for a prolonged period. Instead of using RSI to blindly sell, traders might look for pullbacks towards the 50-level or even the 30-level as potential buying opportunities, assuming the primary trend remains intact. Conversely, in a downtrend, rallies to the 50-level or below 30 could be considered selling opportunities. Combining RSI with moving averages (e.g., 50-day and 200-day simple moving averages) can help confirm the overall trend direction.
- RSI Divergence Trading:
This strategy focuses on identifying bullish or bearish divergences as described above. When a divergence occurs, traders might look for additional confirmation from candlestick patterns, volume changes, or breakouts from trendlines before initiating a trade. For instance, a bullish divergence followed by a break above a resistance level could be a strong entry signal.
- RSI and Support/Resistance:
RSI can be used to confirm the strength of support and resistance levels. If an asset approaches a strong resistance level and the RSI simultaneously moves into overbought territory, it strengthens the case for a potential reversal or pause. Similarly, if an asset tests a key support level while RSI is oversold, it might signal a buying opportunity.
- RSI with Volume Analysis:
Volume can add significant conviction to RSI signals. For example, a bullish divergence on RSI accompanied by increasing buying volume on the subsequent price move higher would generally be considered a more robust signal than one without significant volume confirmation.
RSI in the Current Market Landscape (2026)
The market in 2026 continues to be influenced by evolving macroeconomic factors, technological advancements, and geopolitical shifts. With global equity markets having experienced various phases of volatility and consolidation in recent years, technical indicators like RSI remain crucial for many traders seeking clarity amidst complex price action. The rise of algorithmic trading and high-frequency trading has meant that swift reactions to technical signals are more prevalent, sometimes leading to sharper price moves around key indicator thresholds.
In a landscape where inflation concerns have persisted in some economies, central bank policies remain a focal point. This has implications for asset classes like commodities and growth stocks, where momentum can shift rapidly. Traders applying RSI in 2026 might find its insights particularly valuable in fast-moving sectors, such as emerging technologies or specialized commodities, where sentiment can quickly drive assets into overbought or oversold extremes. Historically, in periods of heightened uncertainty or significant trend changes, the ability of RSI to flag potential reversals or exhaustion points has been particularly appreciated by those navigating such conditions.
Limitations and Best Practices
While a powerful tool, the RSI is not without its limitations:
- False Signals in Strong Trends: In a strong, sustained uptrend, RSI can remain overbought (above 70) for extended periods without a significant reversal. Conversely, in a strong downtrend, it can remain oversold (below 30). Using absolute overbought/oversold levels in isolation during strong trends can lead to premature exits or entries.
- Lagging Nature: Like most technical indicators derived from past price data, RSI is a lagging indicator. It reflects what has already happened, not what will definitively happen in the future.
- Context is Key: RSI signals should always be evaluated within the broader market context, including fundamental analysis, overall market sentiment, and price action itself.
Best Practices for Using RSI:
- Combine with Other Indicators: Always use RSI in conjunction with other technical tools, such as moving averages, MACD, support/resistance levels, and volume analysis, to confirm signals.
- Adapt Parameters: Experiment with different RSI periods (e.g., 7, 21) based on the asset and your trading timeframe. A shorter period makes RSI more sensitive; a longer period makes it smoother.
- Consider Volatility: In highly volatile markets, overbought/oversold signals might occur more frequently but be less reliable. Adjusting thresholds (e.g., 80/20 instead of 70/30) might be appropriate.
- Practice and Backtesting: Before deploying any RSI-based strategy with real capital, it is crucial to backtest it rigorously on historical data and practice in a simulated trading environment to understand its effectiveness and limitations for specific assets.
Effectively integrating the Relative Strength Index into a trading strategy requires a nuanced understanding of its calculations, interpretations, and, critically, its limitations. By combining RSI with other analytical methods, traders can enhance their ability to identify high-probability setups and manage risk in dynamic market conditions.
Disclaimer: This article is provided for general informational and educational purposes only and does not constitute financial, investment, trading, or legal advice. Gainsium is not a registered investment advisor. Markets are volatile and past performance does not guarantee future results. Readers should conduct their own research and consult a licensed financial advisor before making any investment decisions.