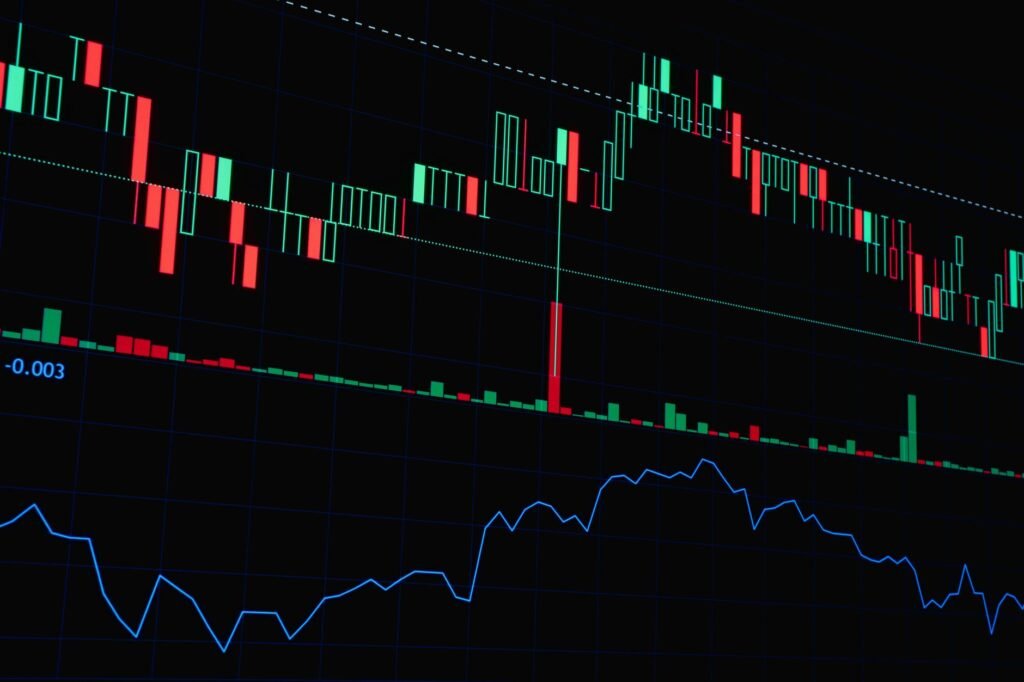

Understanding candlestick patterns is a fundamental skill for many market participants, yet truly implementing a comprehensive candlestick charting strategy requires moving beyond mere pattern identification. This guide explores how to integrate advanced candlestick analysis with broader market context and robust risk management, providing a framework for practical application in 2026’s dynamic trading environment.
The Foundation: Candlestick Context, Not Just Recognition
While recognizing patterns like the Engulfing Bar or Doji is a starting point, their true significance emerges when interpreted within the prevailing market context. A bullish Engulfing pattern occurring at a strong support level after a prolonged downtrend carries far more weight than the same pattern appearing randomly in a choppy market. Traders often consider the ‘story’ the candlesticks are telling in relation to prior price action, volume, and market structure.
Volume as a Confirmation Tool
Volume provides critical insights into the conviction behind a price move. A strong reversal candlestick pattern, such as a Hammer or Shooting Star, gains credibility when accompanied by above-average volume. High volume suggests strong institutional participation and conviction behind the shift in momentum. Conversely, a reversal pattern on low volume might indicate a lack of strong interest, making it a less reliable signal.
Multiple Timeframe Analysis
Integrating various timeframes offers a clearer, more comprehensive view of market dynamics. A common approach involves identifying the larger trend on a higher timeframe (e.g., daily or weekly chart) and then looking for entry signals or pattern confirmations on a lower timeframe (e.g., hourly or 15-minute chart). This synergy helps to filter out noise and align trades with the dominant market direction, enhancing the probability of successful outcomes.
Integrating Candlesticks with Market Structure and Broader Context
Candlestick patterns operate best when viewed as components within the larger framework of market structure. This involves understanding trends, support and resistance zones, and the overall supply and demand dynamics at play. The market landscape in 2026 continues to be shaped by factors such as persistent inflationary pressures in some sectors, adapting central bank policies, and the increasing influence of algorithmic trading, which can amplify volatility. These broader conditions make a structured approach to chart analysis even more pertinent.
Support and Resistance Zones
Key price levels, where buying or selling pressure has historically intensified, are crucial for candlestick interpretation. Reversal patterns appearing precisely at these support or resistance zones often present high-probability setups. For example, a bearish Engulfing pattern at a significant resistance level indicates that sellers have stepped in aggressively at a previously established supply zone. Similarly, a bullish Hammer or Morning Star pattern at a tested support level suggests buyers are defending that demand zone.
Trend Confirmation and Reversal Identification
Candlesticks can confirm the strength of an existing trend or signal a potential reversal. During an uptrend, bullish continuation patterns (like the Three White Soldiers or Bullish Harami) reinforce the trend’s momentum. Conversely, bearish reversal patterns (such as the Dark Cloud Cover or Evening Star) at the peak of an uptrend, especially near resistance, can signal exhaustion and a potential shift in market direction. The reverse applies to downtrends.
Advanced Pattern Application and Confirmation Techniques
Moving beyond basic identification, advanced application involves combining candlestick signals with other analytical tools to build confluence and improve conviction in a trade idea. This approach acknowledges that no single indicator or pattern is infallible.
Confluence with Technical Indicators
Many traders integrate candlestick patterns with other technical indicators for robust confirmation. For instance:
- Moving Averages: A bullish candlestick reversal pattern forming at or above a key moving average (e.g., 50-period or 200-period SMA) can be a strong signal of trend continuation or a bounce from support.
- Oscillators (RSI, Stochastic): A bullish candlestick reversal pattern occurring when an oscillator like the Relative Strength Index (RSI) is in oversold territory can suggest a strong potential for a rebound. Conversely, bearish patterns in overbought territory may signal a downturn.
- Bollinger Bands: Candlesticks that close outside or near the outer bands, followed by a reversal pattern back inside the bands, can indicate overextension and potential mean reversion.
The synergy between these tools helps to validate the signals provided by candlesticks, reducing the likelihood of false signals, especially in markets influenced by rapid sentiment shifts common in 2026.
Understanding Failed Patterns
Not every candlestick pattern leads to the predicted outcome. Recognizing the characteristics of a failed pattern is as important as identifying successful ones. A reversal pattern that is immediately invalidated by a strong counter-move in the opposite direction should be noted, as it provides information about the market’s underlying strength or weakness. This often indicates that the previous trend remains dominant or that a more powerful force is at play.
Risk Management and Strategy Refinement
Even the most sophisticated candlestick charting strategy is incomplete without a rigorous approach to risk management. Market participants in 2026 face a persistent need to adapt strategies due to evolving macroeconomic conditions, technological advancements in trading, and ongoing geopolitical uncertainties impacting various asset classes.
Position Sizing and Stop-Loss Placement
Effective risk management starts with appropriate position sizing, ensuring that no single trade can disproportionately impact the overall trading capital. Stop-loss orders are crucial and should be placed at a logical level based on the candlestick pattern’s structure. For a bullish reversal, a stop-loss is often placed just below the low of the reversal pattern or the underlying support level. For bearish reversals, it would be placed just above the high of the pattern or resistance. This provides a clear invalidation point for the trade idea.
Profit Taking and Trailing Stops
While entry is important, knowing when to exit is equally critical. Traders often establish profit targets based on prior resistance/support levels, Fibonacci extensions, or measured moves derived from chart patterns. Implementing a trailing stop-loss can help protect gains as a trade moves favorably, allowing a position to remain open and capture further upside while limiting exposure to sudden reversals. The income potential from such strategies varies widely, influenced by market conditions, experience, and capital invested, and is never guaranteed.
Continuous Backtesting and Adaptation
Markets are constantly evolving. A candlestick strategy that performed well in one market regime may need adjustments in another. Continuous backtesting (applying the strategy to historical data) and forward testing (applying it in real-time with small capital or a demo account) are vital for validating the strategy’s effectiveness and identifying areas for refinement. This iterative process allows traders to adapt their approach to new market realities, ensuring their candlestick charting strategy remains robust and relevant.
Disclaimer: This article is provided for general informational and educational purposes only and does not constitute financial, investment, trading, or legal advice. Gainsium is not a registered investment advisor. Markets are volatile and past performance does not guarantee future results. Readers should conduct their own research and consult a licensed financial advisor before making any investment decisions.