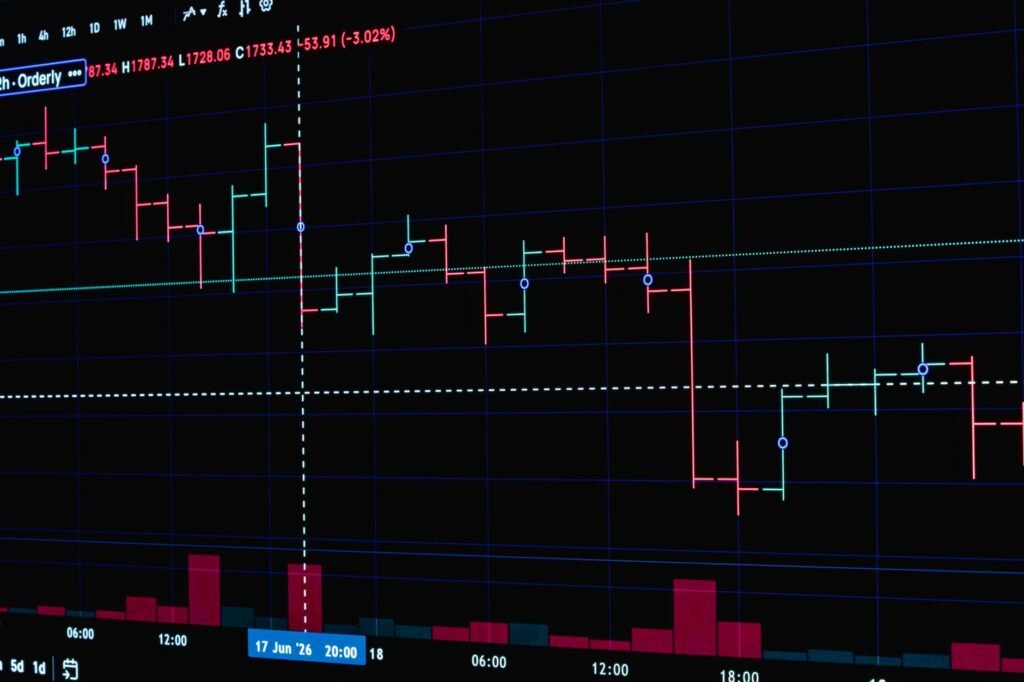

For anyone looking to navigate financial markets, understanding chart patterns is a foundational skill. These visual formations on price charts offer insights into market psychology, helping traders anticipate potential price movements. In 2026, as markets continue to evolve with technological advancements and shifting global economic landscapes, recognizing these fundamental patterns remains crucial for making informed trading decisions, especially for beginners.
While advanced algorithms play an increasingly significant role, human interpretation of these classic signals provides context that can be invaluable. This article will explore five essential chart patterns every beginner trader should know, empowering them to better interpret market dynamics.
Understanding Chart Patterns in the 2026 Market
Technical analysis, the study of historical price and volume data to forecast future price movements, is a widely adopted discipline. Chart patterns are a cornerstone of this analysis, acting as visual representations of supply and demand dynamics. They reflect collective market sentiment – fear, greed, indecision – playing out over various timeframes. Even in 2026, with the proliferation of AI-driven trading tools and high-frequency trading, these basic patterns persist because they capture enduring aspects of human behavior within financial markets.
As global economies continue to rebalance and sectors like AI, renewable energy, and biotech drive market narratives, periods of consolidation, strong trending movements, and reversals are common. Identifying these patterns can help new traders understand when a trend might be strengthening, weakening, or poised to reverse. It’s important to remember that patterns are observational tools and not guarantees of future price action.
1. Reversal Patterns: Signaling a Shift
Reversal patterns indicate that an existing trend is likely to change direction. Recognizing these can be vital for exiting weakening positions or identifying opportunities for new ones.
Head and Shoulders (and Inverse Head and Shoulders)
The Head and Shoulders pattern is one of the most reliable reversal patterns, typically appearing at the peak of an uptrend. It consists of three peaks: a central, highest peak (the ‘head’), flanked by two lower peaks (the ‘shoulders’). A ‘neckline’ connects the lowest points between the peaks. A confirmed break below this neckline, often accompanied by increased volume, suggests a reversal to a downtrend.
Conversely, the Inverse Head and Shoulders pattern appears at the bottom of a downtrend, signaling a potential reversal to an uptrend. Here, the ‘head’ is the lowest point, and the ‘shoulders’ are two higher lows. A break above the neckline in this formation is considered a bullish signal. In 2026’s volatile commodity markets, for instance, identifying these patterns could be particularly insightful for those tracking resource prices influenced by geopolitical events.
Double Top and Double Bottom
The Double Top is a bearish reversal pattern found at the end of an uptrend. It forms when the price reaches a high, pulls back, then rallies again to approximately the same high before falling once more. The inability to break past the previous high signifies strong resistance. A break below the support level formed by the low between the two peaks confirms the reversal. This pattern suggests that buyers have attempted twice to push prices higher but have failed.
The Double Bottom is its bullish counterpart, appearing at the end of a downtrend. The price forms two distinct lows at roughly the same level, separated by a moderate peak. This indicates strong support and a failure of sellers to push prices lower. A break above the resistance level (the peak between the two lows) confirms the bullish reversal. Observing these patterns can be particularly useful in sectors experiencing significant price corrections, as sometimes seen in rapidly expanding tech or green energy markets in 2026.
2. Continuation Patterns: Expecting the Trend to Hold
Continuation patterns suggest that a temporary pause in the current trend is likely to be followed by a resumption of that same trend.
Triangles (Symmetrical, Ascending, Descending)
Triangles are formed by converging trendlines, indicating a period of consolidation before the previous trend continues. They represent indecision in the market, where supply and demand are temporarily in balance before one side takes control.
- Symmetrical Triangle: Characterized by two converging trendlines, one descending resistance and one ascending support, meeting at an apex. This suggests a period of indecision, with the potential for a breakout in either direction, although often in the direction of the preceding trend.
- Ascending Triangle: Features a flat top (horizontal resistance) and a rising bottom (ascending support). This is generally a bullish pattern, indicating buyers are becoming more aggressive while sellers hold a firm resistance level. A breakout above resistance typically confirms an uptrend continuation.
- Descending Triangle: Has a flat bottom (horizontal support) and a falling top (descending resistance). This is usually a bearish pattern, suggesting sellers are becoming more aggressive while buyers hold a firm support level. A break below support often confirms a downtrend continuation.
These patterns are frequently observed in markets experiencing periods of legislative uncertainty or policy changes, which can lead to price consolidation as participants await clarity, a dynamic often seen in the financial regulatory landscape of 2026.
Flags and Pennants
Flags and Pennants are short-term continuation patterns that appear as small, temporary consolidations after a sharp, significant price movement. They represent brief pauses where profits are taken or new positions are established before the original trend resumes.
- Flags: Formed by a small, rectangular price channel that typically slopes against the direction of the initial sharp price move. A bullish flag slopes downwards after an uptrend, while a bearish flag slopes upwards after a downtrend.
- Pennants: Similar to flags, but they form a small symmetrical triangle. After a sharp move, price consolidates into a small triangle before breaking out in the direction of the original trend.
Both patterns imply that the preceding strong move has created strong momentum that is likely to continue. They are particularly useful in fast-moving markets, such as those reacting to quarterly earnings reports or significant economic data releases, common occurrences in 2026’s interconnected global economy.
3. Bilateral Patterns: Preparing for Either Direction
While often categorized as continuation or reversal, some patterns can be bilateral, meaning they can break out in either direction, though with a slight directional bias often present. Wedges are good examples.
Wedges (Rising and Falling)
Wedges are similar to triangles in that they involve converging trendlines, but both lines slope in the same direction. They signal a temporary pause in the trend, but unlike flags, they often precede a reversal rather than a continuation.
- Rising Wedge: Formed by two upward-sloping, converging trendlines. While price is rising, the narrowing range and upward slope often indicate weakening buying pressure. A rising wedge typically breaks to the downside, acting as a bearish reversal pattern.
- Falling Wedge: Formed by two downward-sloping, converging trendlines. While price is falling, the narrowing range and downward slope often indicate weakening selling pressure. A falling wedge typically breaks to the upside, acting as a bullish reversal pattern.
Wedges are important for identifying potential exhaustion in a trend. In 2026, as certain sectors like legacy industries face structural shifts, recognizing these patterns can help identify when a long-term decline might be nearing its end or an unsustainable rally might be topping out.
Navigating Chart Patterns in 2026
For beginner traders, mastering these five essential chart patterns—Head and Shoulders, Double Top/Bottom, Triangles, Flags/Pennants, and Wedges—provides a strong foundation for technical analysis. These patterns encapsulate timeless market psychology and remain relevant even amidst the advanced trading technologies and dynamic market conditions of 2026. While algorithms might execute trades at lightning speed, the underlying sentiment reflected in these patterns often persists. They offer valuable insights into potential shifts or continuations in price trends.
It is important to remember that chart patterns are most effective when combined with other forms of analysis, such as volume indicators, moving averages, or fundamental analysis. No single pattern guarantees a specific outcome, and false breakouts can occur. Diligent practice, continuous learning, and robust risk management strategies are indispensable for any aspiring trader. By incorporating these visual cues into a broader analytical framework, new traders can enhance their ability to interpret market signals and make more informed decisions.
Disclaimer: This article is provided for general informational and educational purposes only and does not constitute financial, investment, trading, or legal advice. Gainsium is not a registered investment advisor. Markets are volatile and past performance does not guarantee future results. Readers should conduct their own research and consult a licensed financial advisor before making any investment decisions.