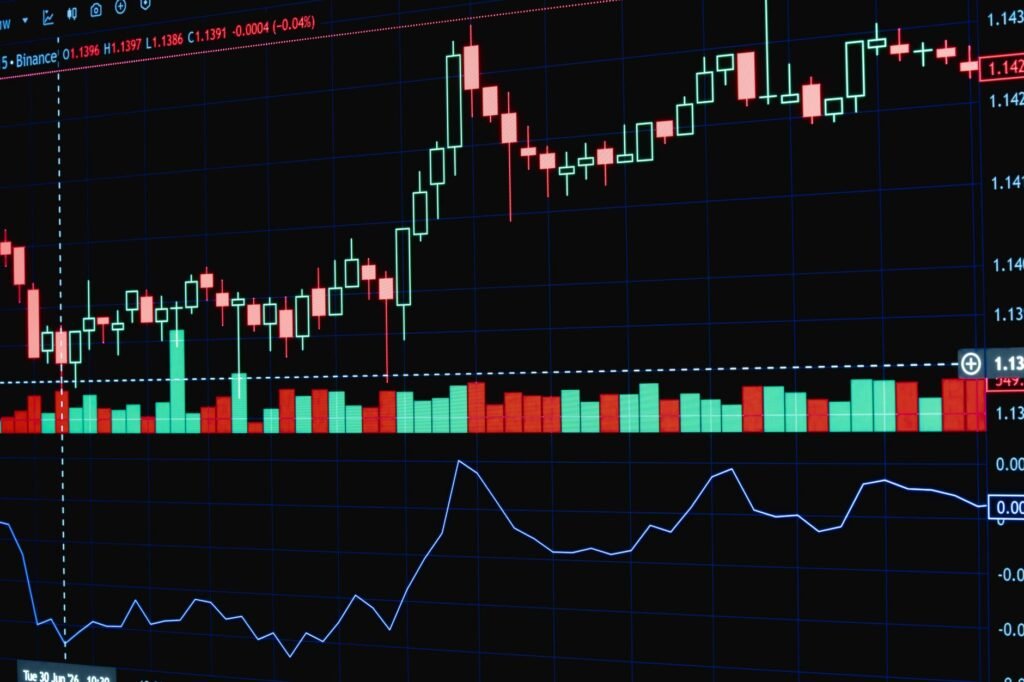

Short-term trading can be a dynamic pursuit, and for those looking to navigate its intricacies, understanding how to effectively utilize technical indicators is fundamental. This beginner’s guide aims to explain how short-term traders can employ common technical indicators to inform their trading decisions, helping to identify potential entry and exit points in fast-moving markets. These tools, when used correctly and in conjunction with sound risk management, can provide valuable insights into market behavior.
Understanding Technical Analysis Fundamentals
Technical analysis is a trading discipline employed to evaluate investments and identify trading opportunities by analyzing statistical trends gathered from trading activity, such as price movement and volume. For short-term traders, this approach focuses on interpreting price charts to forecast future price movements. Unlike fundamental analysis, which examines a company’s intrinsic value, technical analysis is concerned with market psychology and the supply and demand dynamics reflected in price action.
The accessibility of trading platforms and sophisticated charting tools has grown significantly throughout the 2020s, making technical analysis more prevalent for individual traders. In an environment shaped by evolving economic landscapes and the rapid dissemination of information, understanding these visual cues has become a cornerstone for many seeking to capitalize on brief market fluctuations.
Essential Technical Indicators for Short-Term Trading
A range of technical indicators exists, each offering a unique perspective on market conditions. For short-term trading, a few stand out as particularly useful for identifying momentum, trends, and potential reversals.
Moving Averages (MAs)
Moving Averages smooth out price data over a specified period, making it easier to identify trends. Common types include the Simple Moving Average (SMA) and the Exponential Moving Average (EMA). EMAs give more weight to recent prices, making them more responsive to new information, which can be advantageous for short-term analysis.
- How to Use: Traders often look for price to cross above or below a moving average to signal a potential trend change. A popular strategy involves observing crossovers of two different MAs (e.g., a 10-period EMA crossing above a 30-period EMA) to signal bullish momentum, or vice versa for bearish signals. MAs can also act as dynamic support and resistance levels.
Relative Strength Index (RSI)
The RSI is a momentum oscillator that measures the speed and change of price movements. It oscillates between zero and 100 and is typically used to identify overbought or oversold conditions in an asset.
- How to Use: Readings above 70 generally indicate an asset is overbought, suggesting a potential for a price pullback or reversal. Readings below 30 suggest an asset is oversold, potentially indicating a bounce. Short-term traders might look for RSI divergences, where the price makes a new high but the RSI does not, signaling weakening momentum.
Moving Average Convergence Divergence (MACD)
The MACD is a trend-following momentum indicator that shows the relationship between two moving averages of a security’s price. It is calculated by subtracting the 26-period Exponential Moving Average (EMA) from the 12-period EMA. The result of that calculation is the MACD line. A nine-period EMA of the MACD line is then plotted on top of the MACD line and acts as a signal line.
- How to Use: Traders watch for the MACD line to cross above the signal line (a bullish crossover) or below it (a bearish crossover) to generate buy or sell signals. The distance between the MACD line and the signal line, represented by the histogram, can indicate the strength of the momentum.
Bollinger Bands
Bollinger Bands are a volatility indicator that consists of a simple moving average (the middle band) and two outer bands representing standard deviations from that moving average. The bands expand and contract based on market volatility.
- How to Use: Prices tend to revert to the middle band. When prices touch or exceed the upper band, an asset may be overbought; when they touch or fall below the lower band, it may be oversold. A ‘squeeze’ where the bands narrow significantly often precedes a period of high volatility or a significant price move. Traders also look for price breaking out of the bands as a sign of strong trend continuation.
Integrating Indicators for Trading Decisions
While individual indicators provide valuable insights, their true power for short-term traders often lies in their combined use. Relying on a single indicator can lead to false signals and suboptimal decisions.
The Importance of Confluence
Confluence in technical analysis refers to the concept of multiple indicators or analysis techniques aligning to provide the same signal. For example, a short-term trader might look for a bullish moving average crossover, confirmed by an RSI moving out of oversold territory, and a bullish MACD crossover before considering a long position. This multi-indicator approach helps to filter out noise and increase the probability of a successful trade.
In today’s fast-paced markets, where algorithmic trading and high-frequency trading contribute to rapid price swings, confirming signals across various tools can be particularly beneficial. For instance, in 2026, with persistent global inflation concerns and evolving interest rate environments shaping market sentiment, confirming trend signals becomes even more critical.
Risk Management and Stop-Loss Orders
No technical indicator or combination of indicators guarantees profitability. Market conditions can change rapidly, and unforeseen news events can invalidate technical setups. Therefore, robust risk management is paramount for short-term traders.
- Stop-Loss Orders: Placing a stop-loss order is a fundamental risk management technique. This order automatically closes a trade if the price moves against the trader’s position by a predetermined amount, limiting potential losses.
- Position Sizing: Properly sizing one’s trades to only risk a small percentage of total capital on any single trade is also essential.
Adaptability and Market Conditions
The effectiveness of indicators can vary depending on the prevailing market regime. Some indicators perform better in trending markets, while others are more suited for ranging or volatile conditions. Successful short-term traders learn to adapt their chosen indicators and strategies to the current market environment. Continuous learning and backtesting strategies on historical data are vital for refining one’s approach.
Limitations and Further Considerations
It is important to remember that most technical indicators are lagging indicators, meaning they are derived from past price data and do not predict the future with certainty. They provide probabilities and insights into market structure, but not guarantees. While technical analysis focuses on price action, major fundamental news events (e.g., central bank announcements, earnings reports) can override technical signals instantly. Short-term traders often monitor economic calendars to be aware of such events.
Ultimately, technical indicators are tools in a trader’s arsenal. Their effective use requires discipline, practice, and a keen understanding of market dynamics. While this guide provides a foundation, continued study and practical application are key to developing proficiency in short-term trading decisions.
Disclaimer: This article is provided for general informational and educational purposes only and does not constitute financial, investment, trading, or legal advice. Gainsium is not a registered investment advisor. Markets are volatile and past performance does not guarantee future results. Readers should conduct their own research and consult a licensed financial advisor before making any investment decisions.